2024-04-18
Research Group of Small and Micro-sized Enterprise Operating Index
I. SMEOI decreased within the contraction range
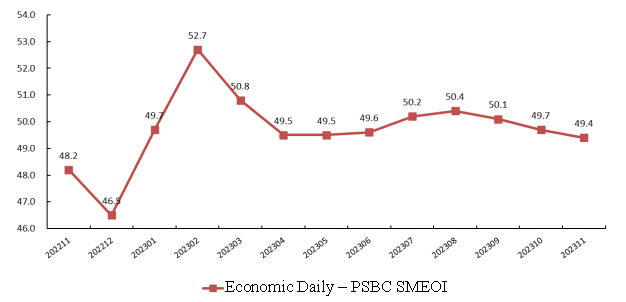
In November 2023, the Economic Daily – PSBC Small and Micro-sized Enterprise Operating Index (Fig. 1, hereinafter referred to as “SMEOI”) reported 49.4, down 0.3 point over the previous month. The index continued the previous month’s downward trend and has fallen for three consecutive months since August.
Fig. 1 Economic Daily – PSBC SMEOI


II. Two out of the eight subindices increased, five decreased, and one remained unchanged, with the financing index and cost index rising slightly
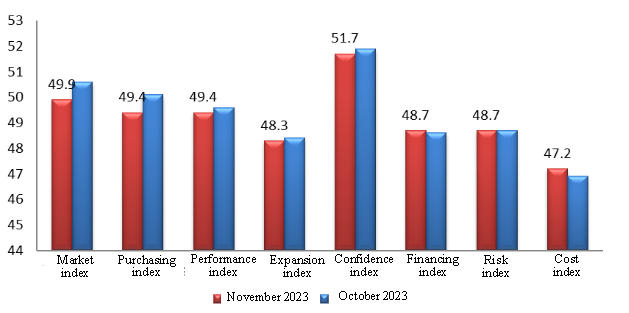
Two out of the eight subindices increased, five decreased, and one remained unchanged in November (Fig. 2). Specifically, the market index was 49.9, down 0.7 point; the purchasing index stood at 49.4, down 0.7 point; the performance index registered 49.4, down 0.2 point; the expansion index read 48.3, down 0.1 point; the confidence index posted 51.7, down 0.2 point; the financing index recorded 48.7, up 0.1 point; the risk index closed at 48.7, on par with the previous month; and the cost index was 47.2, up 0.3 point.
Among the eight subindices, only the confidence index ran above the boom threshold, indicating that confidence was growing. The market index and purchasing index fell from the range of prosperity to below the threshold, indicating that the market demand situation and purchasing level faced by enterprises reversed the previous upward trend and fell from the previous month. The performance index and expansion index continued to decline below the threshold, indicating that enterprises’ performance declined and expansion continued to weaken. The financing index and cost index rose from the previous month. As for subindices, both the financing difficulty index and the next-period financing demand index increased by 0.1 point over the previous month, the bookings index decreased by 0.7 point, and the raw material purchasing index decreased by 0.8 point.
Fig. 2 Subindices of Economic Daily – PSBC SMEOI


In term of the trend over the past 12 months, the confidence index stayed above the boom threshold more frequently, which reflected the rising confidence of micro and small enterprises; the purchasing index and market index ran above the boom threshold more frequently than other subindices, indicating that the micro and small enterprise market was in good condition and the purchasing level was steadily improving.
III. One out of the six regional indices increased, four decreased, and one remained unchanged, with North China dropping the most
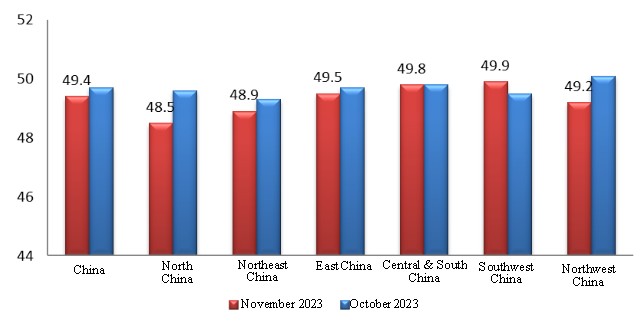
One out of the six regional indices increased, four decreased, and the other one remained unchanged (Fig. 3). Specifically, the North China index reported 48.5, down 1.1 points; the Northeast China index registered 48.9, down 0.4 point; the East China index read 49.5, down 0.2 point; the Central & South China index posted 49.8, the same as last month; the Southwest China increased by 0.4 point to 49.9; and the Northwest China index dropped by 0.9 point to 49.2.
Fig. 3 Regional Development Index


In November, the indices of all regions stayed below the boom threshold. Specifically, the Southwest China index rose below the threshold, which was mainly reflected in a shift from a declining purchasing level to a rising trend and the improvement of corporate performance. The Northwest China index fell from the range of prosperity to below the threshold, which was mainly reflected in a decline in the purchasing level, a decline in corporate performance, and a drop in the expansion level. The North China index dropped the most, which was mainly reflected in the narrowing market demand, weakening expansion and declining purchasing level.
IV. Two out of the seven industry indices increased, and the other five decreased, with the wholesale & retail industry and service industry indices rising slightly
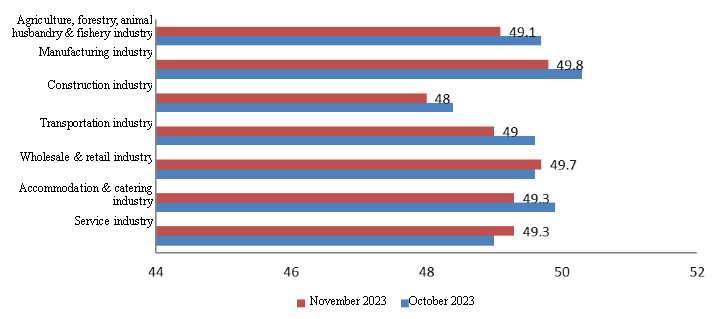
Two out of the seven industry indices increased, and the other five decreased (Fig. 4). Specifically, the index of the agriculture, forestry, animal husbandry & fishery industry reported 49.1, down 0.6 point; that of the manufacturing industry posted 49.8, down 0.5 point; that of the construction industry stood at 48, down 0.4 point; that of the transportation industry registered 49, down 0.6 point; that of the wholesale & retail industry went up by 0.1 point to 49.7; that of the accommodation & catering industry decreased by 0.6 point to 49.3, and that of the service industry reported 49.3, up 0.3 point.
Fig. 4 Comparison of Industry Indices


In November, the manufacturing industry fell from the range of prosperity to below the boom threshold, indicating that micro and small enterprises in the manufacturing industry experienced a declining trend this month, a reversal from the previous development. The agriculture, forestry, animal husbandry & fishery industry, construction industry, transportation industry, and accommodation & catering industry declined below the threshold. The wholesale & retail industry and service industry rose below the boom threshold, indicating that the operating conditions of micro and small enterprises in the two industries declined but at a narrowing trend, which was mainly reflected in the steady increase in market demand and improving financing situations.
Notes:
All indicators are positive indicators, with a value range of 0-100, and 50 as the critical point representing the general condition. An index above 50 indicates positive conditions of enterprises, while an index below 50 indicates the downward trend of enterprises.
Both the risk index and the cost index are adjusted to positive indicators based on the raw data. The larger the index value, the better the situation.