2022-07-29
Research Group of Economic Daily – PSBC Small and Micro-sized Enterprise Operating Index
I. SMEOI continued to recover, reaching the level at the beginning of year
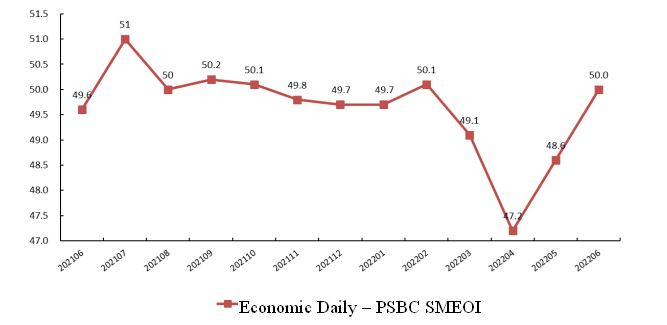
In June 2022, the Economic Daily – PSBC Small and Micro-sized Enterprise Operating Index (Fig. 1, hereinafter referred to as “SMEOI”) reported 50, up 1.4 points over the previous month. SMEOI has fluctuated around the critical value since May 2021, and began to rebound after reaching a record low in April 2022. The figure has reached the year-beginning level this month.
Fig. 1 Economic Daily – PSBC SMEOI

II. One (cost index) of the eight subindices decreased, while the other seven increased
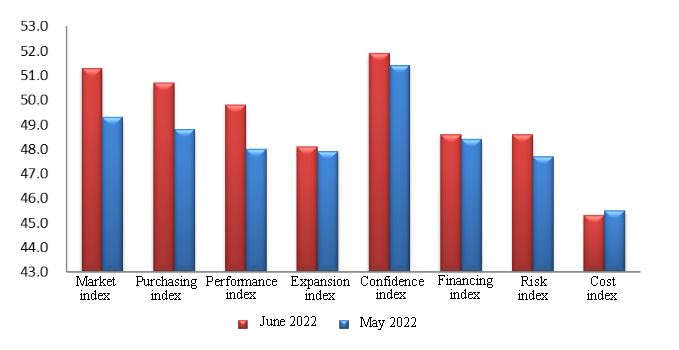
Among the eight subindices (Fig. 2), only one decreased, while the other seven went up. Specifically, the market index was 51.3, up 2 points; the purchasing index stood at 50.7, up 1.9 points; the performance index registered 49.8, up 1.8 points; the expansion index read 48.1, up 0.2 point; the confidence index posted 51.9, up 0.5 point; the financing index recorded 48.6, up 0.2 point; the risk index closed at 48.6, up 0.9 point; and the cost index dropped by 0.2 point to 45.3.
Fig. 2 Subindices of Economic Daily – PSBC SMEOI
III. All the six regional indices increased, with North China rising the most
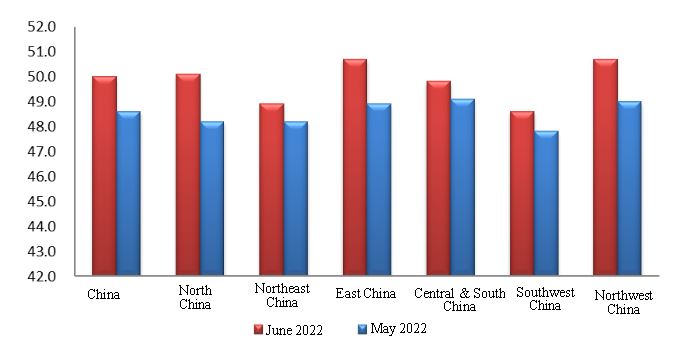
All the six regional indices (Fig. 3) went up. Specifically, the North China index reported 50.1, up 1.9 points; the Northeast China index registered 48.9, up 0.7 point; the East China index read 50.7, up 1.8 points; the Central & South China index posted 49.8, up 0.7 point; the Southwest China index increased by 0.8 point to 48.6; and the Northwest China index rose by 1.7 points to 50.7.
Fig. 3 Regional Development Index
IV. All the seven industry indices increased, with the accommodation & catering industry rising the most
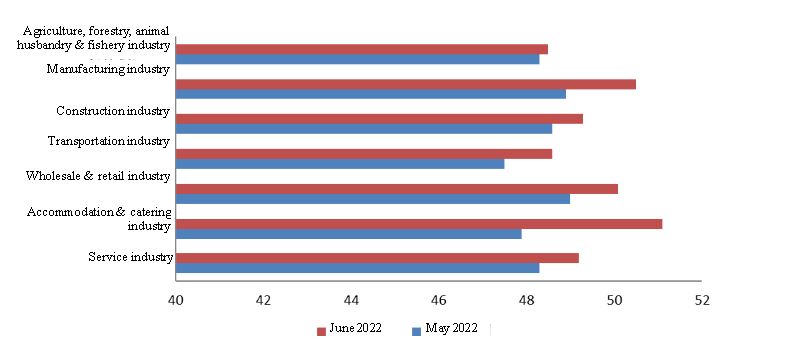
All the seven industry indices (Fig. 4) increased over the previous month. Specifically, the index of the agriculture, forestry, animal husbandry & fishery industry reported 48.5, up 0.2 point; that of the manufacturing industry posted 50.5, up 1.6 points; that of the construction industry stood at 49.3, up 0.7 point; that of the wholesale & retail industry went up by 1.1 points to 50.1; that of the transportation industry registered 48.6, up 1.1 points; that of the accommodation & catering industry increased by 3.2 points to 51.1 and that of the service industry reported 49.2, up 0.9 point.
Fig. 4 Comparison of Industry Indices
Notes:
All indicators are positive indicators, with a value range of 0-100, and 50 as the critical point representing the general condition. An index above 50 indicates positive conditions of enterprises, while an index below 50 indicates the downward trend of enterprises.
Both the risk index and the cost index are adjusted to positive indicators based on the raw data. The larger the index value, the better the situation.

Copyright(C)2024 psbc.com All Rights Reserved 中国邮政储蓄银行 版权所有 京ICP备07021605号
 Mobile Bank
 Wechat