2021-11-15
Operating Results to Be Improved amid Overall Recovery Trend
Research Group of Economic Daily – PSBC Small and Micro-sized Enterprise Operating Index
The Economic Daily – PSBC Small and Micro-sized Enterprise Operating Index (hereinafter referred to as “SMEOI”) (See Fig. 1) reported 44.4 in October, down by 0.1 point from the previous month. SMEOI has improved steadily since October 2020, and the overall recovery trend remained unchanged despite slight fluctuations in recent months. The market index and performance index showed a continuous overall recovery trend; the confidence index, purchasing index, expansion index and risk index fluctuated at a certain level; and the financing index and cost index remained above the prosperity threshold. This reflects a continuously improving financing environment for micro and small enterprises (MSEs) as the overall costs keeps declining.
Fig. 1 Economic Daily – PSBC SMEOI

In October, of the eight subindices, two remained unchanged and the other six went down (See Fig 2). Specifically, the market index was 40, down 0.1 point; the purchasing index stood at 42.5, down 0.1 point; the performance index registered 44.4, down 0.2 point; the expansion index read 42.5, down 0.1 point; the confidence index posted 41.6, down 0.1 point; the financing index recorded 52.9, on par with that in the previous month; the risk index remained the same as last month at 49; and the cost index closed at 62.7, down 0.2 point.
Fig. 2 Subindices of Economic Daily – PSBC SMEOI
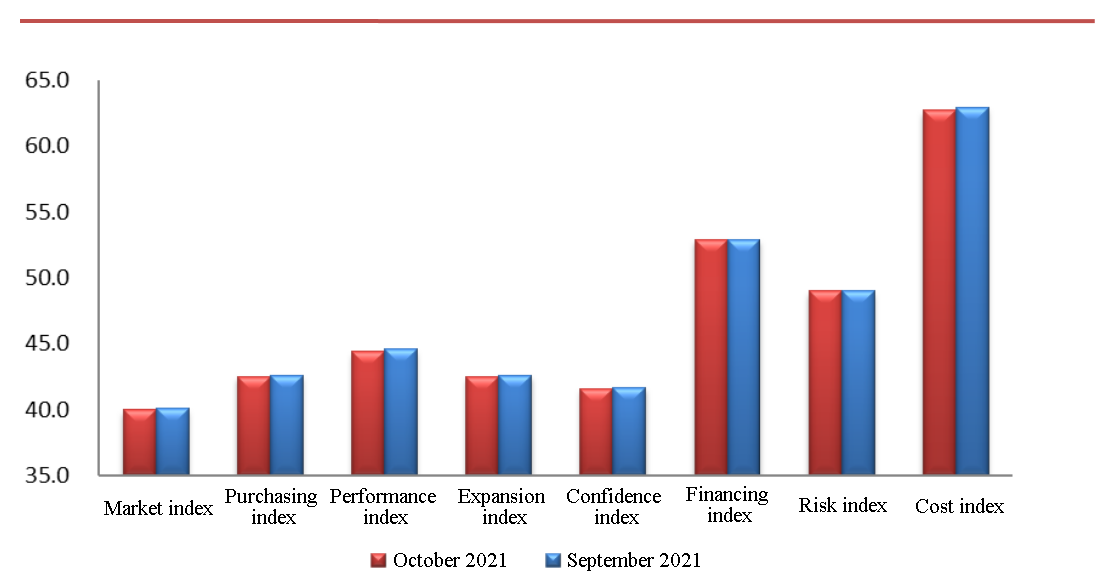
Table 1 Changes of SMEOI and Subindices in the Past 12 Months
Index name | SMEOI | Market index | Purchasing index | Performance index | Expansion index | Confidence index | Financing index | Risk index | Cost index |
Nov-20 | 44.0 | 39.5 | 42.3 | 44.2 | 42.7 | 41.3 | 52.3 | 48.5 | 62.6 |
Dec-20 | 44.1 | 39.5 | 42.1 | 44.2 | 42.8 | 41.1 | 52.8 | 48.8 | 62.5 |
Jan-21 | 44.1 | 39.6 | 42.2 | 44.4 | 42.6 | 41.0 | 52.8 | 48.8 | 62.6 |
Feb-21 | 44.1 | 39.5 | 42.1 | 44.3 | 42.6 | 41.4 | 52.8 | 48.9 | 63.2 |
Mar-21 | 44.3 | 39.8 | 42.4 | 44.5 | 42.7 | 41.4 | 52.9 | 48.9 | 62.9 |
Apr-21 | 44.3 | 39.7 | 42.4 | 44.6 | 42.7 | 41.4 | 52.9 | 48.8 | 62.9 |
May-21 | 44.3 | 39.5 | 42.2 | 44.5 | 42.8 | 41.1 | 53.2 | 49.2 | 63.2 |
Jun-21 | 44.3 | 39.8 | 42.4 | 44.3 | 42.6 | 41.4 | 52.9 | 48.9 | 63.0 |
Jul-21 | 44.4 | 40.0 | 42.5 | 44.5 | 42.6 | 41.6 | 52.9 | 49.0 | 63.0 |
Aug-21 | 44.3 | 39.9 | 42.3 | 44.4 | 42.5 | 41.5 | 52.9 | 48.9 | 63.1 |
Sep-21 | 44.5 | 40.1 | 42.6 | 44.6 | 42.6 | 41.7 | 52.9 | 49.0 | 62.9 |
Oct-21 | 44.4 | 40.0 | 42.5 | 44.4 | 42.5 | 41.6 | 52.9 | 49.0 | 62.7 |
Two out of the seven industry indices remained unchanged and the other five declined
As to SMEOI, two out of the seven industry indices remained unchanged and the other five declined (See Fig. 3). To be specific, the index of the agriculture, forestry, animal husbandry & fishery industry reported 43.6 in October, down 0.2 point. The market index went down by 0.3 point to 39.8; the purchasing index decreased by 0.2 point to 41.4; and the performance index dropped by 0.4 point to 43.4. According to the survey results, the output of MSEs in the agriculture, forestry, animal husbandry & fishery industry decreased by 0.2 point, orders on par with the previous month, income from principal business down 0.5 point, raw material procurement down 0.3 point, raw material inventory down 0.2 point, profit down 0.6 point, and gross profit margin down 0.2 point.
Fig. 3 Comparison of Industry Indices
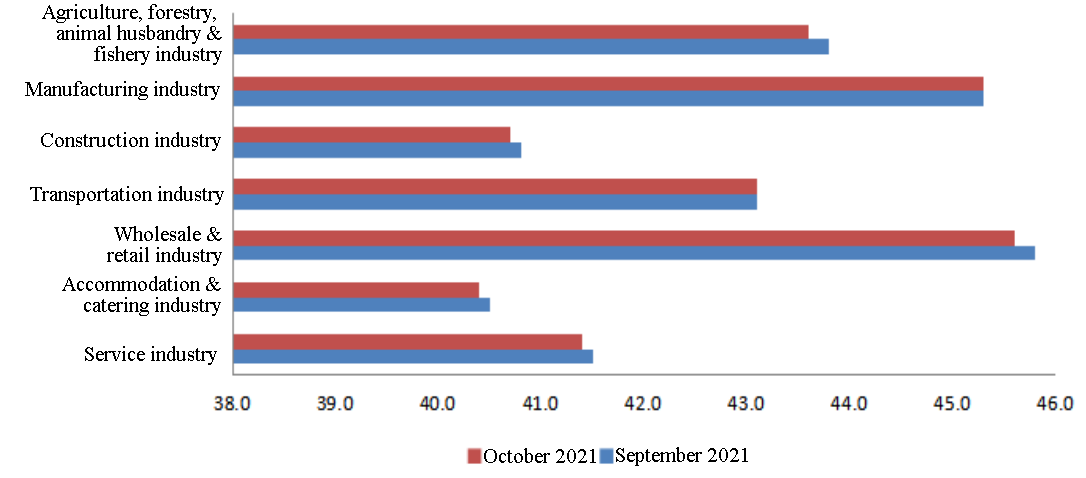
The index of the manufacturing industry reported 45.3, the same as last month. To be specific, the market index stood at 39.2, the same as last month; the purchasing index decreased by 0.1 point to 39.8; the performance index was 48, down 0.1 point. According to the survey results, the output, orders (OEM) and income from principal business (income from product sales) of MSEs in the manufacturing industry remained unchanged as last month, while raw material procurement went down by 0.1 point, raw material inventory, profit and gross profit margin down by 0.1, 0.2 and 0.1 point, respectively.
The index of the construction industry reported 40.7, down 0.1 point. To be specific, the market index registered 36.9, down 0.3 point; the purchasing index remained the same as the previous month at 38.4; the performance index was 41.8, down 0.2 point. According to the survey results, the engineering volume of MSEs in the construction industry went down by 0.4 point, new construction contract value down 0.2 point, project settlement income down 0.3 point, raw material procurement and raw material inventory on par with the previous month, profit down 0.3 point, and gross profit margin down 0.1 point.
The index of the transportation industry reported 43.1, the same as the previous month. To be specific, the market index was 40.9, down 0.1 point; the purchasing index remained unchanged at 37.3; and the performance index decreased by 0.2 point to 43.1. According to the survey results, the freight volume (passenger/cargo) of MSEs in the transportation industry remained unchanged compared with last month, business orders dropped 0.2 point, income from principal business remained unchanged, raw material procurement up 0.2 point, raw material inventory down 0.2 point, profit down 0.2 point, and gross profit margin down 0.2 point.
The index of the wholesale & retail industry reported 45.6, down 0.2 point. To be specific, the market index, the purchasing index and the performance index were 42.8, 49.4 and 42.5 respectively, all down by 0.2 point. According to the survey results, the sales order, sales amount, purchase volume, profit and gross profit margin of MSEs in the wholesale & retail industry went down by 0.2 point, 0.2 point, 0.2 point, 0.3 point and 0.1 point, respectively.
The index of the accommodation & catering industry reported 40.4, down 0.1 point. To be specific, the market index, the purchasing index and the performance index were 39.3, 39.3 and 40, respectively, down by 0.3 point, 0.1 point and 0.2 point. According to the survey results, the business volume of MSEs in the accommodation & catering industry went down by 0.4 point, income (turnover) from principal business down 0.3 point, raw material procurement down 0.2 point, raw material inventory on par with last month, profit down 0.1 point, and gross profit margin down 0.2 point.
The index of the service industry reported 41.4, down 0.1 point. To be specific, the market index was on par with that in the previous month, while the purchasing index and the performance index were 41.4 and 39.6, respectively, down 0.1 point and 0.2 point. According to the survey results, the business volume of MSEs in the service industry increased by 0.1 point, business orders down 0.1 point, income (turnover) from principal business up 0.1 point, raw material procurement on par with last month, raw material inventory down 0.2 point, profit down 0.2 point, and gross profit margin down 0.2 point.
Table 2 Changes to Each Industry Index by Subindices
SMEOI | Market index | Purchasing index | Performance index | Expansion index | Confidence index | Financing index | Risk index | Cost index | |
SMEOI | -0.1 | -0.1 | -0.1 | -0.2 | -0.1 | -0.1 | 0.0 | 0.0 | -0.2 |
Agriculture, forestry, animal husbandry & fishery industry | -0.2 | -0.3 | -0.2 | -0.4 | -0.1 | 0.1 | 0.0 | -0.1 | -0.1 |
Manufacturing industry | 0.0 | 0.0 | -0.1 | -0.1 | -0.1 | 0.0 | 0.0 | 0.1 | -0.3 |
Construction industry | -0.1 | -0.3 | 0.0 | -0.2 | -0.1 | -0.1 | -0.1 | -0.1 | -0.1 |
Transportation industry | 0.0 | -0.1 | 0.0 | -0.2 | 0.1 | -0.3 | 0.1 | -0.1 | -0.3 |
Wholesale & retail industry | -0.2 | -0.2 | -0.2 | -0.2 | 0.0 | -0.2 | 0.0 | -0.1 | -0.1 |
Accommodation & catering industry | -0.1 | -0.3 | -0.1 | -0.2 | 0.0 | -0.1 | 0.0 | -0.1 | -0.1 |
Service industry | -0.1 | 0.0 | -0.1 | -0.2 | -0.1 | -0.1 | -0.1 | 0.0 | -0.1 |
One out of six regional indices went up and the other five went down
Of the six regional indices, one went up and the other five went down (See Fig. 4). The North China index reported 42.2, down 0.1 point. Specifically, the market index was 37.2, down 0.2 point; the purchasing index stood at 39.7, on par with last month; the performance index registered 42, down 0.2 point; the expansion index read 37.9, down 0.1 point; the confidence index posted 38.2, down 0.2 point; the financing index recorded 54.3, the same as last month; the risk index decreased by 0.1 point to 47.2; and the cost index closed at 68.2, the same as last month.
Fig. 4 Regional Development Index
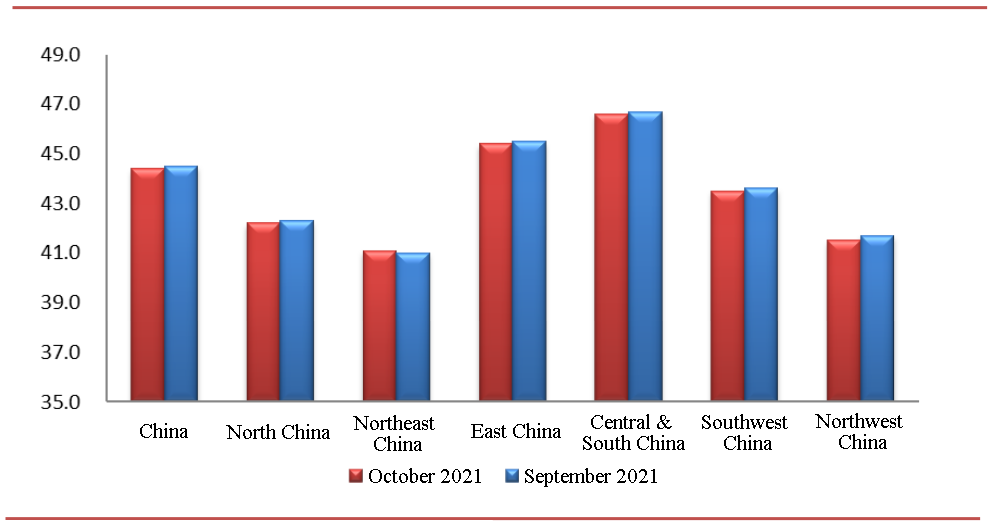
The Northeast China index reported 41.1, up 0.1 point. Specifically, the market index was 35, on par with the previous month; the purchasing index stood at 37.8, the same as the prior month; the performance index registered 41.6, the same as last month; the expansion index was 39, up 0.3 point; the confidence index posted 42.4, the same as last month; the financing index recorded 50, up 0.1 point; the risk index read 53.7, up 0.2 point; and the cost index closed at 69 after a drop of 0.3 point.
The East China index reported 45.4, down 0.1 point. Specifically, the market index was 43.9, the same as last month; the purchasing index stood at 45.4, the same as last month; the performance index registered 45.7, down 0.1 point; the expansion index dropped 0.1 point to 44.2; the confidence index posted 41.9, down 0.1 point; the financing index recorded 49.4, down 0.1 point; the risk index read 48.3, on par with that of last month; and the cost index closed at 60.7, unchanged from last month.
The Central & South China index reported 46.6, down 0.1 point. Specifically, the market index was 44.5, down 0.1 point; the purchasing index stood at 46, down 0.1 point; the performance index registered 44.6, the same as last month; the expansion index stood at 44.6, down 0.1 point; the confidence index posted 41.9, the same as last month; the financing index recorded 55.3, the same as last month; the risk index read 47.5, the same as last month; and the cost index closed at 64.4 after a drop of 0.2 point.
The Southwest China index reported 43.5, down 0.1 point. Specifically, the market index went down by 0.1 point to 41.5; the purchasing index was 44.2 after a drop of 0.2 point; the performance index registered 44.5, down 0.4 point; the expansion index stood at 43.7, the same as last month; the confidence index posted 37.9, the same as the previous month; the financing index recorded 48.4, the same as last month; the risk index read 48.9, up 0.1 point; and the cost index closed at 60.1 after a rise of 0.1 point.
The Northwest China index reported 41.5, down 0.2 point. Specifically, the market index was 37.3, down 0.3 point; the purchasing index stood at 37.6, down 0.2 point; the performance index registered 44.1, down 0.3 point; the expansion index stood at 39.3, down 0.2 point; the confidence index posted 33.1, down 0.3 point; the financing index recorded 49.8, the same as last month; the risk index read 48.2, the same as last month; and the cost index closed at 65 after a decline of 0.1 point.
Table 3 Changes to Each Regional Index by Component Indices
SMEOI | Market index | Purchasing index | Performance index | Expansion index | Confidence index | Financing index | Risk index | Cost index | |
SMEOI | -0.1 | -0.1 | -0.1 | -0.2 | -0.1 | -0.1 | 0.0 | 0.0 | -0.2 |
North China | -0.1 | -0.2 | 0.0 | -0.2 | -0.1 | -0.2 | 0.0 | -0.1 | 0.0 |
Northeast China | 0.1 | 0.0 | 0.0 | 0.0 | 0.3 | 0.0 | 0.1 | 0.2 | -0.3 |
East China | -0.1 | 0.0 | 0.0 | -0.1 | -0.1 | -0.1 | -0.1 | 0.0 | 0.0 |
Central & South China | -0.1 | -0.1 | -0.1 | 0.0 | -0.1 | 0.0 | 0.0 | 0.0 | -0.2 |
Southwest China | -0.1 | -0.1 | -0.2 | -0.4 | 0.0 | 0.0 | 0.0 | 0.1 | 0.1 |
Northwest China | -0.2 | -0.3 | -0.2 | -0.3 | -0.2 | -0.3 | 0.0 | 0.0 | -0.1 |
The expansion index and confidence index dropped slightly
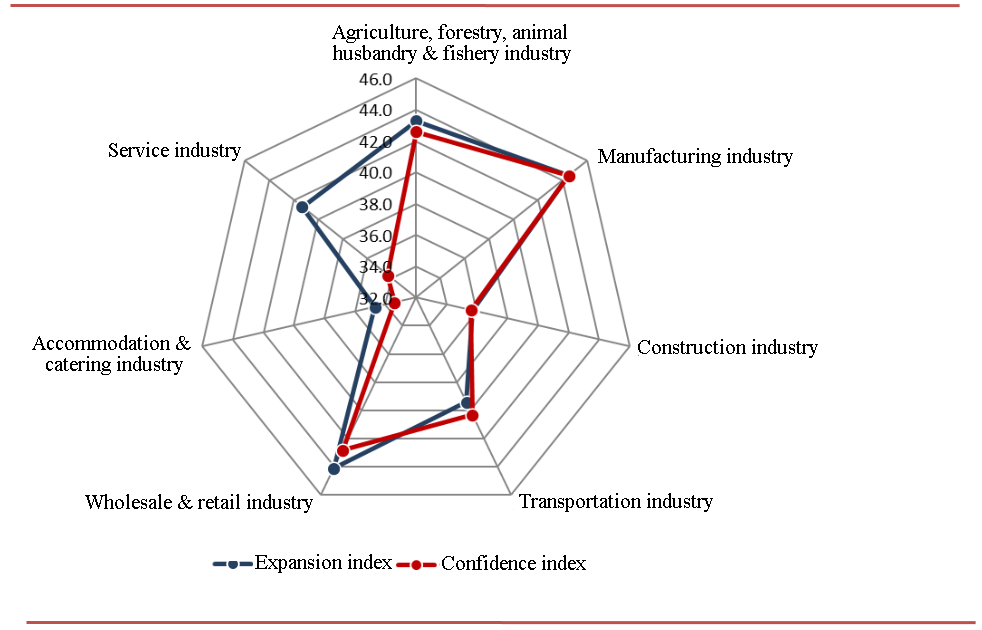
In October, the expansion index reflecting the business expectations of MSEs stood at 42.5, down 0.1 from last month. By industry, the expansion index of the agriculture, forestry, animal husbandry & fishery industry was 43.3, down 0.1 point; that of the manufacturing industry reported 44.5, down 0.1 point; that of the construction industry read 35.7, down 0.1 point; that of the transportation industry registered 39.4, up 0.1 point; that of the wholesale & retail industry stood at 44.1, the same as last month; that of the accommodation & catering industry posted 34.7, the same as last month; and that of the service industry was 41.3, down 0.1 point. According to the survey results, the new investments of MSEs in the agriculture, forestry, animal husbandry & fishery industry decreased by 0.1 point, while the number of new employees down 0.2 point; both of the new investments and number of new employees of MSEs in the manufacturing industry went down by 0.1 point; the new investments (mechanical equipment) of MSEs in the construction industry dropped by 0.2 point, while the number of new employees decreased by 0.1 point; both the new investments (transportation tools etc.) and the number of new employees of MSEs in the transportation industry increased by 0.1 point; the new investments of MSEs in the wholesale & retail industry dropped by 0.1 point, while the number of new employees remained the same as last month; the new investments (storefronts, business area and equipment) of MSEs in the accommodation & catering industry remained unchanged compared with the previous month, while the number of new employees decreased by 0.1 point; both of the new investments (storefronts, business area and equipment) and the number of new employees of MSEs in the service industry went down by 0.1 point.
In October, the confidence index of MSEs dropped 0.1 point to 41.6. By industry, the confidence index of the agriculture, forestry, animal husbandry & fishery industry was 42.6, up 0.1 point; that of the manufacturing industry reported 44.5, the same as last month; that of the construction industry read 35.6, down 0.1 point; that of the transportation industry registered 40.3, down 0.3 point; that of the wholesale & retail industry stood at 42.8, down 0.2 point; that of the accommodation & catering industry posted 33.4, down 0.1 point; and that of the service industry was 34.3, down 0.1 point.
Fig. 5 Expansion Index and Confidence Index by Industry

Copyright(C)2024 psbc.com All Rights Reserved 中国邮政储蓄银行 版权所有 京ICP备07021605号
 Mobile Bank
 Wechat