2021-07-13
Small and Micro-sized Enterprises Demonstrated Enhanced Vitality
Research Group of Economic Daily –PSBC Small and Micro-sized Enterprise Operating Index
Over the past 12 months, the Economic Daily –PSBC Small and Micro-sized Enterprise Operating Index (SMEOI)showed an overall steady and upward trend. Specifically, the market index and the performance index showed continuous recovery; the confidence index, the purchasing index, the expansion index and the risk index fluctuated at a certain level; while the financing index and the cost index remained above the threshold, reflecting the continuous improvement of financing environment for SMEs and the continuous decline of comprehensive costs.
Figure 1 Economic Daily –PSBC Small and Micro-sized Enterprise Operating Index

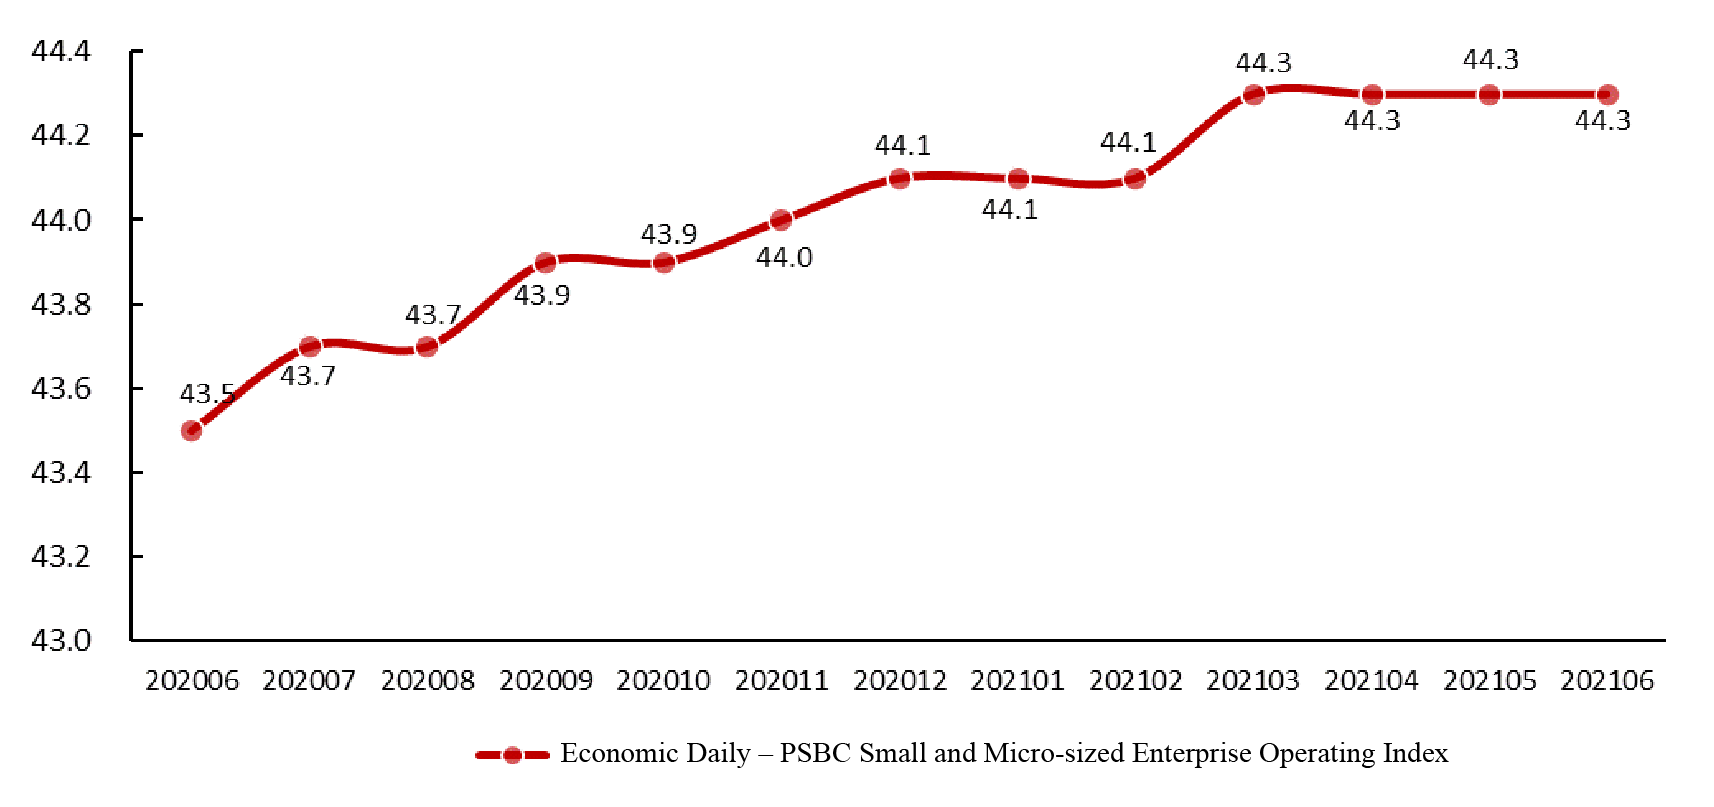

Table 1 Trends in the Economic Daily - PSBC SMEOIand Component Indices over the Past 12 Months
Indicator | Economic Daily-PSBC SMEOI | Market index | Purchasing index | Performance index | Expansion index | Confidence index | Financing index | Risk index | Cost index |
July 2020 | 43.7 | 39.3 | 41.8 | 43.7 | 42.9 | 40.9 | 51.7 | 48.7 | 62.4 |
August 2020 | 43.7 | 39.2 | 42.0 | 43.6 | 42.7 | 41.2 | 51.8 | 48.6 | 62.6 |
September 2020 | 43.9 | 39.3 | 42.2 | 44.0 | 43.0 | 41.4 | 52.2 | 48.5 | 62.7 |
October 2020 | 43.9 | 39.3 | 42.4 | 44.0 | 42.9 | 41.6 | 52.0 | 48.4 | 62.4 |
November 2020 | 44.0 | 39.5 | 42.3 | 44.2 | 42.7 | 41.3 | 52.3 | 48.5 | 62.6 |
December 2020 | 44.1 | 39.5 | 42.1 | 44.2 | 42.8 | 41.1 | 52.8 | 48.8 | 62.5 |
January 2021 | 44.1 | 39.6 | 42.2 | 44.4 | 42.6 | 41.0 | 52.8 | 48.8 | 62.6 |
February 2021 | 44.1 | 39.5 | 42.1 | 44.3 | 42.6 | 41.4 | 52.8 | 48.9 | 63.2 |
March 2021 | 44.3 | 39.8 | 42.4 | 44.5 | 42.7 | 41.4 | 52.9 | 48.9 | 62.9 |
April 2021 | 44.3 | 39.7 | 42.4 | 44.6 | 42.7 | 41.4 | 52.9 | 48.8 | 62.9 |
May 2021 | 44.3 | 39.5 | 42.2 | 44.5 | 42.8 | 41.1 | 53.2 | 49.2 | 63.2 |
June 2021 | 44.3 | 39.8 | 42.4 | 44.3 | 42.6 | 41.4 | 52.9 | 48.9 | 63.0 |
Two of the seven industry indices went up and the other five remained unchanged
The indices of the agriculture, forestry, animal husbandry & fishery andtransportation industriesclimbed.
Among the industry indices, the indices of the agriculture, forestry, animal husbandry & fishery andtransportation industries increased by 0.1 point compared with last month, while others remained unchanged.
Figure 2 Comparison of Industry Indices
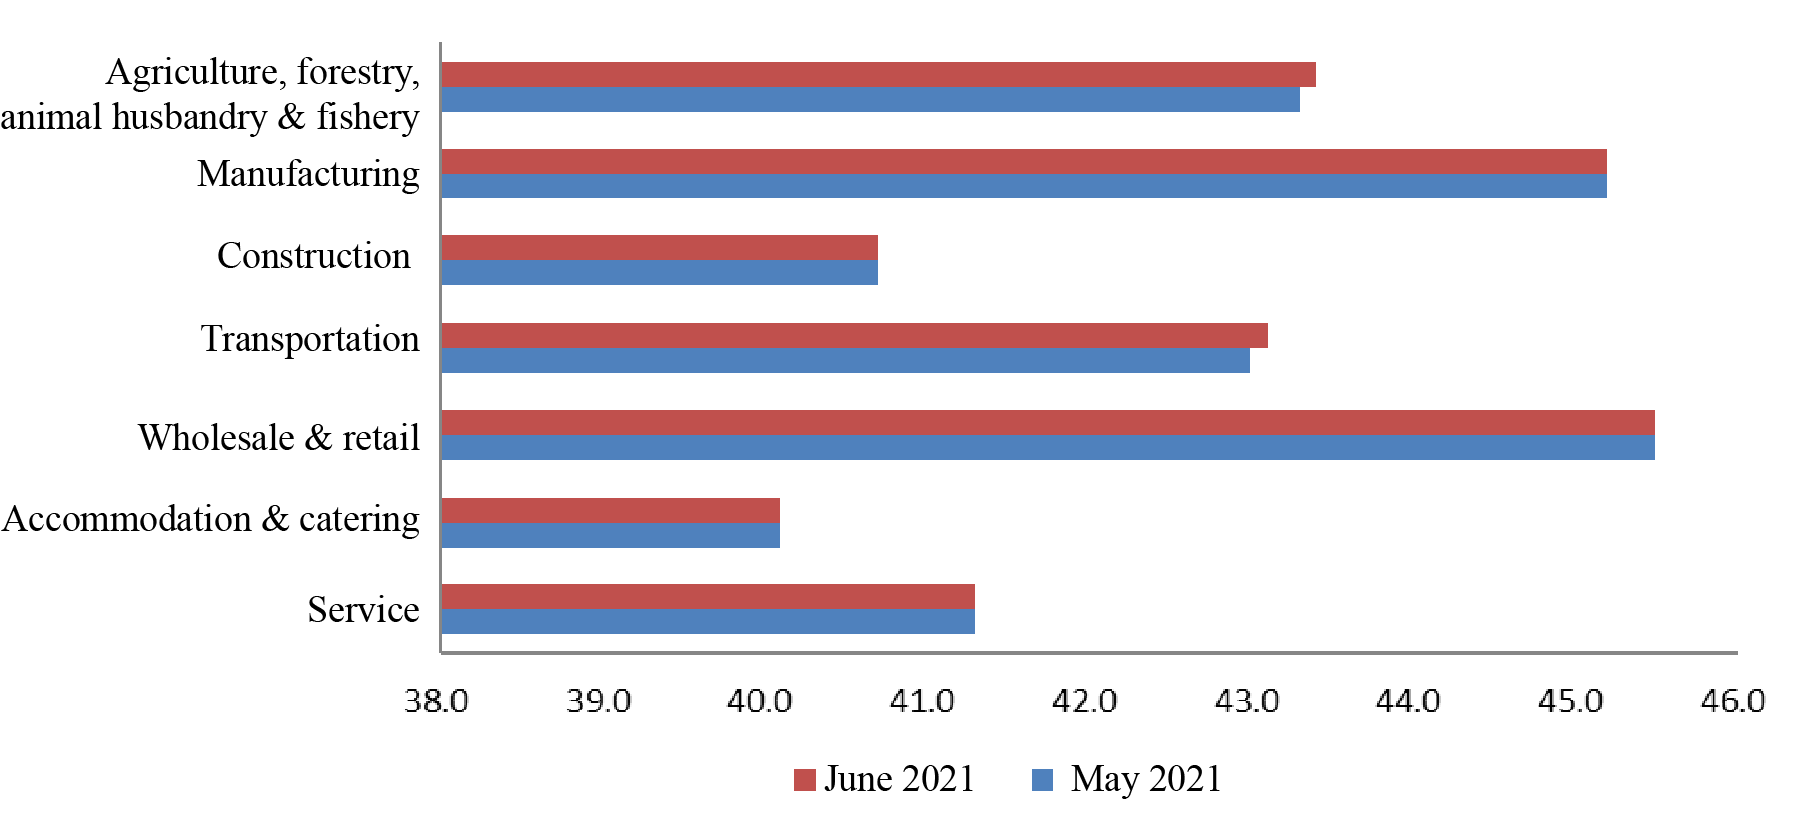
Specifically, the index of the agriculture, forestry, animal husbandry & fishery industry reported43.4 in June, up 0.1 point from the previous month; the index of the manufacturing industry reported 45.2, the same as the previous month; the index of the construction industry was 40.7, the same as the previous month; the index of the transportation industry stood at 43.1, up 0.1 point; the index of the wholesale & retail industry posted 45.5, unchanged from the previous month; the index of the accommodation & catering industry was 40.1, the same as the previous month; and the index of the service industry registered 41.3, unchanged from the previous month.
Regarding changes in component indicesin each industry, as for the agriculture, forestry, animal husbandry & fishery industry,the market index, purchasing index, expansion index and confidence index went up over the previous month, with the purchasing index increasing the most by 0.3 point. As for the manufacturing industry, the market index, purchasing index and confidence index increased by 0.3 point. As for the construction industry, the market index, purchasing index and confidence index rose, with the market index rising the most by 0.4 point. As for the transportation industry, the market index, purchasing index, performance index and confidence index rose, with the purchasing index rising the most by 0.3 point. As for the wholesale & retail industry, the market index and confidence index went up, with the market index rising the most by 0.4 point. As for the accommodation & catering industry, the market index, purchasing index and confidence index climbed, with the purchasing index and confidence index rising the most by 0.3 point. As for the service industry, the market index, purchasing index and confidence index increased, with the purchasing index rising the most by 0.3 point.
Table 2 Changes in Industry Indices
Economic Daily-PSBC SMEOI | Market index | Purchasing index | Performance index | Expansion index | Confidence index | Financing index | Risk index | Cost index | |
Economic Daily-PSBC SMEOI | 0.0 | 0.3 | 0.2 | -0.2 | -0.2 | 0.3 | -0.3 | -0.3 | -0.2 |
Agriculture, forestry, animal husbandry & fishery | 0.1 | 0.2 | 0.3 | -0.1 | 0.1 | 0.2 | -0.1 | -0.2 | -0.3 |
Manufacturing | 0.0 | 0.3 | 0.3 | -0.2 | -0.1 | 0.3 | -0.3 | -0.3 | -0.2 |
Construction | 0.0 | 0.4 | 0.1 | -0.2 | -0.3 | 0.3 | -0.2 | -0.2 | -0.2 |
Transportation | 0.1 | 0.2 | 0.3 | 0.1 | -0.2 | 0.2 | -0.1 | -0.2 | -0.1 |
Wholesale & retail | 0.0 | 0.4 | -0.2 | -0.3 | -0.2 | 0.2 | -0.4 | -0.3 | -0.2 |
Accommodation & catering | 0.0 | 0.2 | 0.3 | -0.1 | -0.3 | 0.3 | -0.4 | -0.3 | -0.2 |
Service | 0.0 | 0.2 | 0.3 | -0.2 | -0.2 | 0.2 | -0.3 | -0.2 | -0.2 |
Three out of the six regional indices went up, one remained unchanged, and the other two went down.
The Northeast China index rose the most
Among the six regional indices, the Northeast China index, the East China index and the Northwest China index went up.
Figure 3 Regional Indices
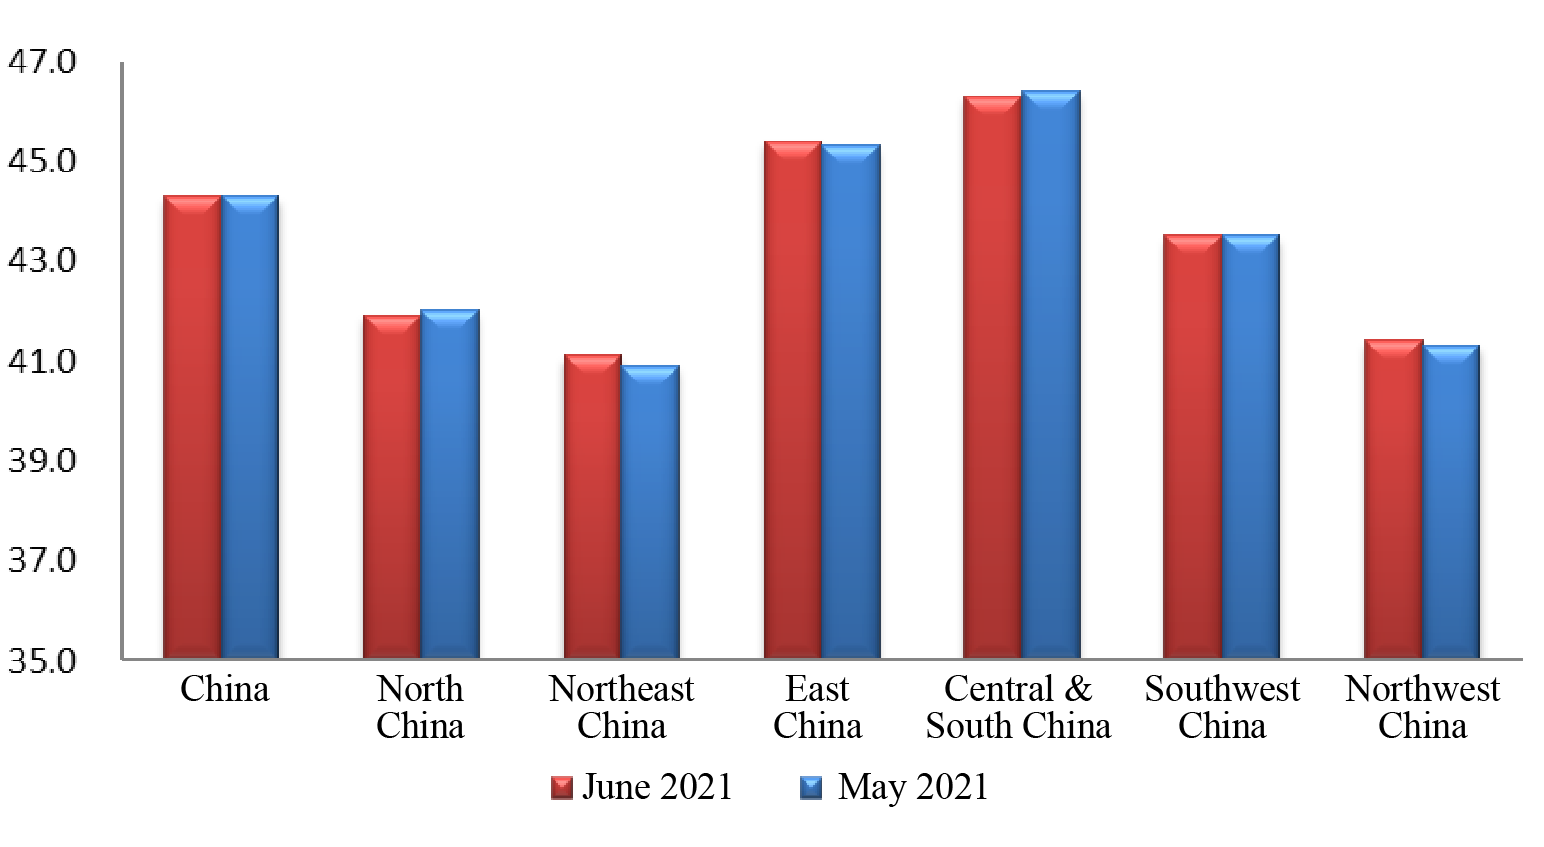
The North China index reported 41.9 in June, down 0.1 point from the previous month. Two out of the eight component indices rose, and the other six dropped. Specifically, the market index and cost index recorded 36.7 and 68.4 respectively, both up 0.2 point; the risk index fell the most by 0.4 point.
The Northeast China index reported 41.1 in June, up 0.2 point from the previous month. Six out of the eight component indices rose, and the other two dropped. Specifically, the financing index and cost index fell by 0.2 point and 0.3 point to 49.9 and 69.1, respectively; the market index rose the most by 0.4 point.
The East China index reported 45.4 in June, up 0.1 point from the previous month. Three out of the eight component indices rose, and the other five dropped. Specifically, all of the market index, purchasing index and confidence index edged up 0.3 point to 43.7, 45.2 and 41.9 respectively.
The Central & South China index reported 46.3 in June, down 0.1 point from the previous month. Three out of the eight component indices rose, and the other five dropped. Specifically, the market index, confidence index and cost index gained 0.2 point, 0.3 point and 0.1 point to 44, 41.9 and 64.6, respectively; the financing index dropped the most by 0.4 point.
The Southwest China index reported 43.5 in June, on apar with that in the previous month. Three out of the eight component indices rose, four dropped, and the other one remained unchanged. Specifically, the market index, purchasing index and confidence index gained 0.3 point, 0.2 point and 0.3 point to 41.5, 44 and 37.8, respectively.
The Northwest China index reported 41.4 in June, up 0.1 point from the previous month. Four out of the eight component indices rose, three dropped, and the other one remained unchanged. Specifically, the performance index, financing index and risk index fell by 0.1 point, 0.3 point and 0.1 point to 44, 50 and 48.1, respectively; all of the market index, purchasing index and confidence index increased by 0.3 point.
Table 3 Changes in Indicators by Region
Economic Daily-PSBC SMEOI | Market index | Purchasing index | Performance index | Expansion index | Confidence index | Financing index | Risk index | Cost index | |
Economic Daily-PSBC SMEOI | 0.0 | 0.3 | 0.2 | -0.2 | -0.2 | 0.3 | -0.3 | -0.3 | -0.2 |
North China | -0.1 | 0.2 | -0.2 | -0.2 | -0.1 | -0.1 | -0.3 | -0.4 | 0.2 |
Northeast China | 0.2 | 0.4 | 0.2 | 0.1 | 0.1 | 0.3 | -0.2 | 0.2 | -0.3 |
East China | 0.1 | 0.3 | 0.3 | -0.1 | -0.1 | 0.3 | -0.1 | -0.2 | -0.3 |
Central & South China | -0.1 | 0.2 | -0.2 | -0.1 | -0.1 | 0.3 | -0.4 | -0.2 | 0.1 |
Southwest China | 0.0 | 0.3 | 0.2 | -0.2 | 0.0 | 0.3 | -0.2 | -0.2 | -0.2 |
Northwest China | 0.1 | 0.3 | 0.3 | -0.1 | 0.1 | 0.3 | -0.3 | -0.1 | 0.0 |
The market index and purchasing index went up
The expansion index declined
The market index reflecting the market of SMEs went up by 0.3 point to 39.8 in June. From the perspective of industry, the market index of the agriculture, forestry, animal husbandry & fishery industry stood at 39.5, up 0.2 point; that of the manufacturing industry went up by 0.3 point to 38.9; that of the construction industry rose by 0.4 point to 37.2; that of the transportation industry climbed 0.2 point to 40.8; that of the wholesale & retail industry rose by 0.4 point to 42.6; that of the accommodation & catering industry increased by 0.2 point to 38.9; that of the service industry rose by 0.2 point to 36.8. According to the survey results, the tier-3 indices of output, order volume and main business income of the market index all rose.
Figure 4 Market Index and Purchasing Indexby Industry

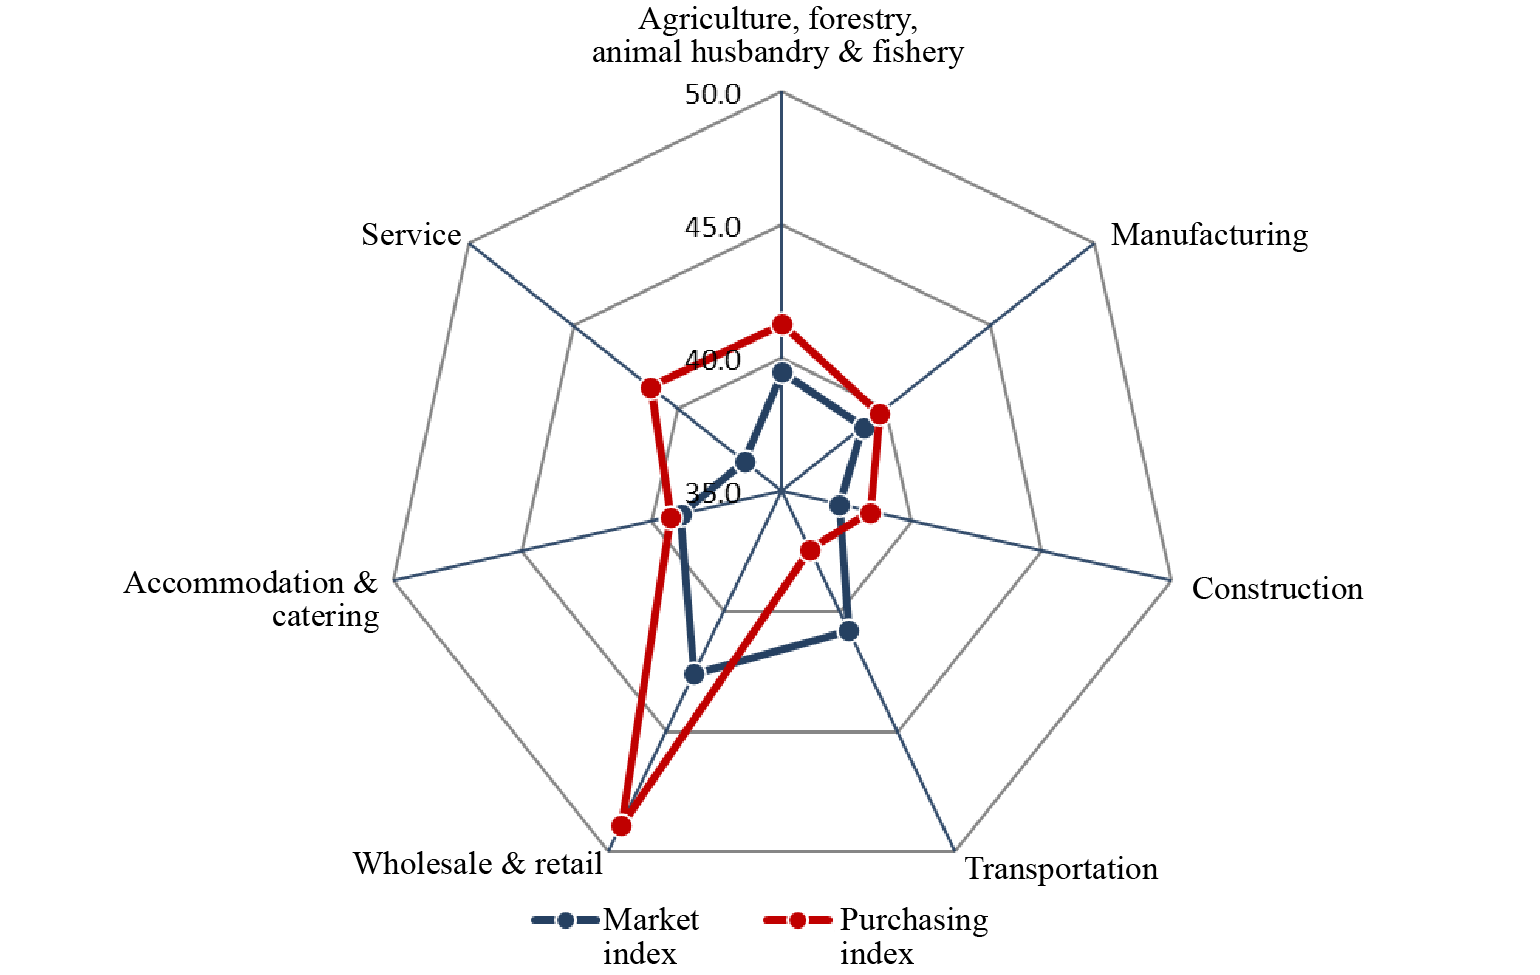

The purchasing index of SMEs stood at 42.4 in June, up 0.2 point from the previous month. To be specific, the purchasing index of the agriculture, forestry, animal husbandry & fishery was 41.3, up 0.3 point; that of the manufacturing industry was 39.7, up 0.3 point; that of the construction industry rose by 0.1 point to 38.4; that of the transportation industry went up by 0.3 point to 37.4; that of the wholesale & retail industry decreased by 0.2 point to 48.9; that of the accommodation & catering industry climbed by 0.3 point to 39.3; that of the service industry rose by 0.3 point to 41.3.
According to the survey results, the raw material procurement volume index of the manufacturing, construction, transportation, accommodation & catering and service industries all rose, while that of the agriculture, forestry, animal husbandry & fishery industry stayed the same as last month.
Figure
5 Expansion Index and Confidence Index by Industry

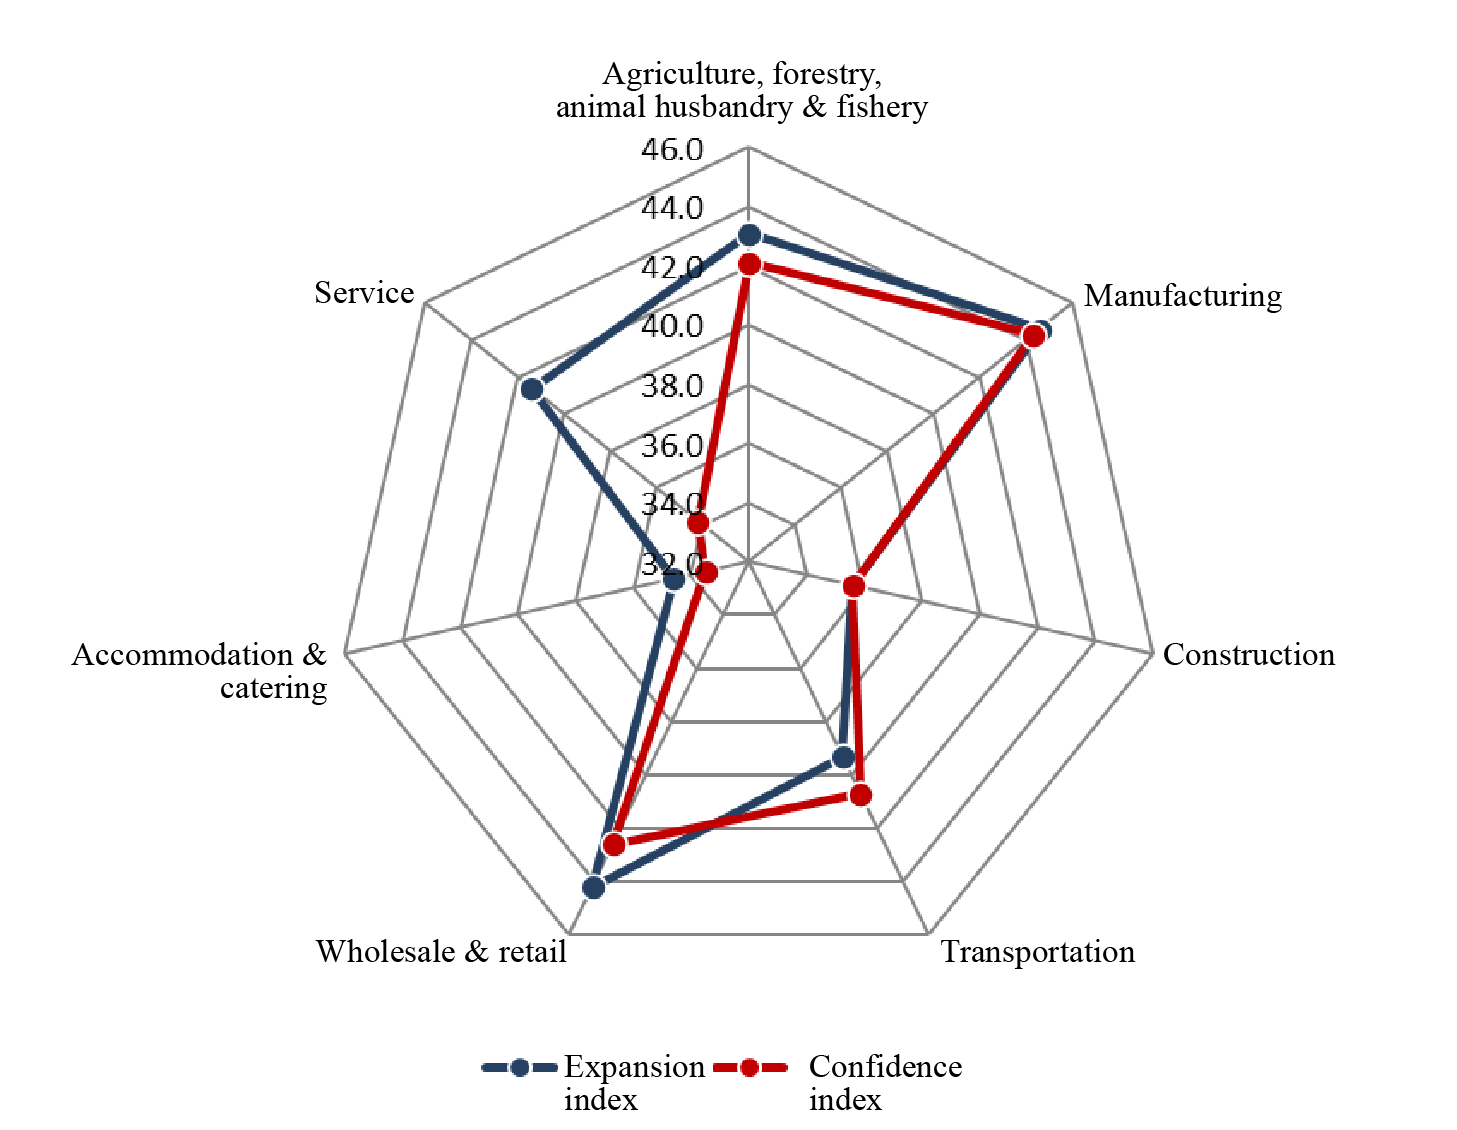

In June, the expansion index reflecting the operation expectations of SMEs declined by 0.2 point over the previous month, and the confidence index went up by 0.3 point.
The expansion index dropped 0.2 point to 42.6. From the perspective of industry, the expansion index of one out of the seven industries climbed, while that of the other six industries dropped. Specifically, the expansion index of the agriculture, forestry, animal husbandry & fishery industry stood at 43.1, up 0.1 point; that of the manufacturing industry stood at 44.6, down 0.1 point; that of the construction industry dropped by 0.3 point to 35.6; that of the transportation industry declined by 0.2 point to 39.3; that of the wholesale & retail industry decreased by 0.2 point to 44.2; that of the accommodation & catering industry went down by 0.3 point to 34.6; that of the service industry shrank by 0.2 point to 41.4.
According to the survey results, the new investments of the agriculture, forestry, animal husbandry & fishery industry went up by 0.1 point, while the number of employees remained at the same level with the previous month; the new investments of the manufacturing industry increased by 0.1 point, and the number of employees remained at the same level with the previous month; the new investments (machinery and equipment) and the number of employees of the construction industry dropped by 0.4 point and 0.3 point, respectively; the new investments (means of transport, etc.) of the transportation industry fell by 0.2 point, and the number of new employees climbed by 0.1 point; the new investments and the number of new employees of the wholesale & retail industry decreased by 0.2 point and 0.4 point, respectively; the new investments (storefronts, business area and equipment) and the number of employees of the accommodation & catering industry dropped by 0.5 point and 0.2 point, respectively; the new investments (storefronts, business area and equipment) of the service industry declined by 0.1 point, and the number of employees remained the same as that of the previous month.
In June, the confidence index of SMEs edged up by 0.3 point to 41.4. To be specific, the confidence index of the agriculture, forestry, animal husbandry & fishery industry increased by 0.2 point to 42.1; that of the manufacturing industry went up by 0.3 point to 44.3; that of the construction industry rose by 0.3 point to 35.6; that of the transportation industry went up by 0.2 point to 40.7; that of the wholesale & retail industry edged up by 0.2 point to 42.6; that of the accommodation & catering industry increased by 0.3 to 33.5; that of the service industry increased by 0.2 point to 34.2.

Copyright(C)2024 psbc.com All Rights Reserved 中国邮政储蓄银行 版权所有 京ICP备07021605号

 Mobile Bank
 Wechat