2021-04-15
Research Group of Economic Daily – PSBC Small and Micro-sized Enterprise Operating Index
I. The overall index rose from the previous month, and the business operation of small and micro-sized enterprises (SMEs) recovered steadily overthe past year
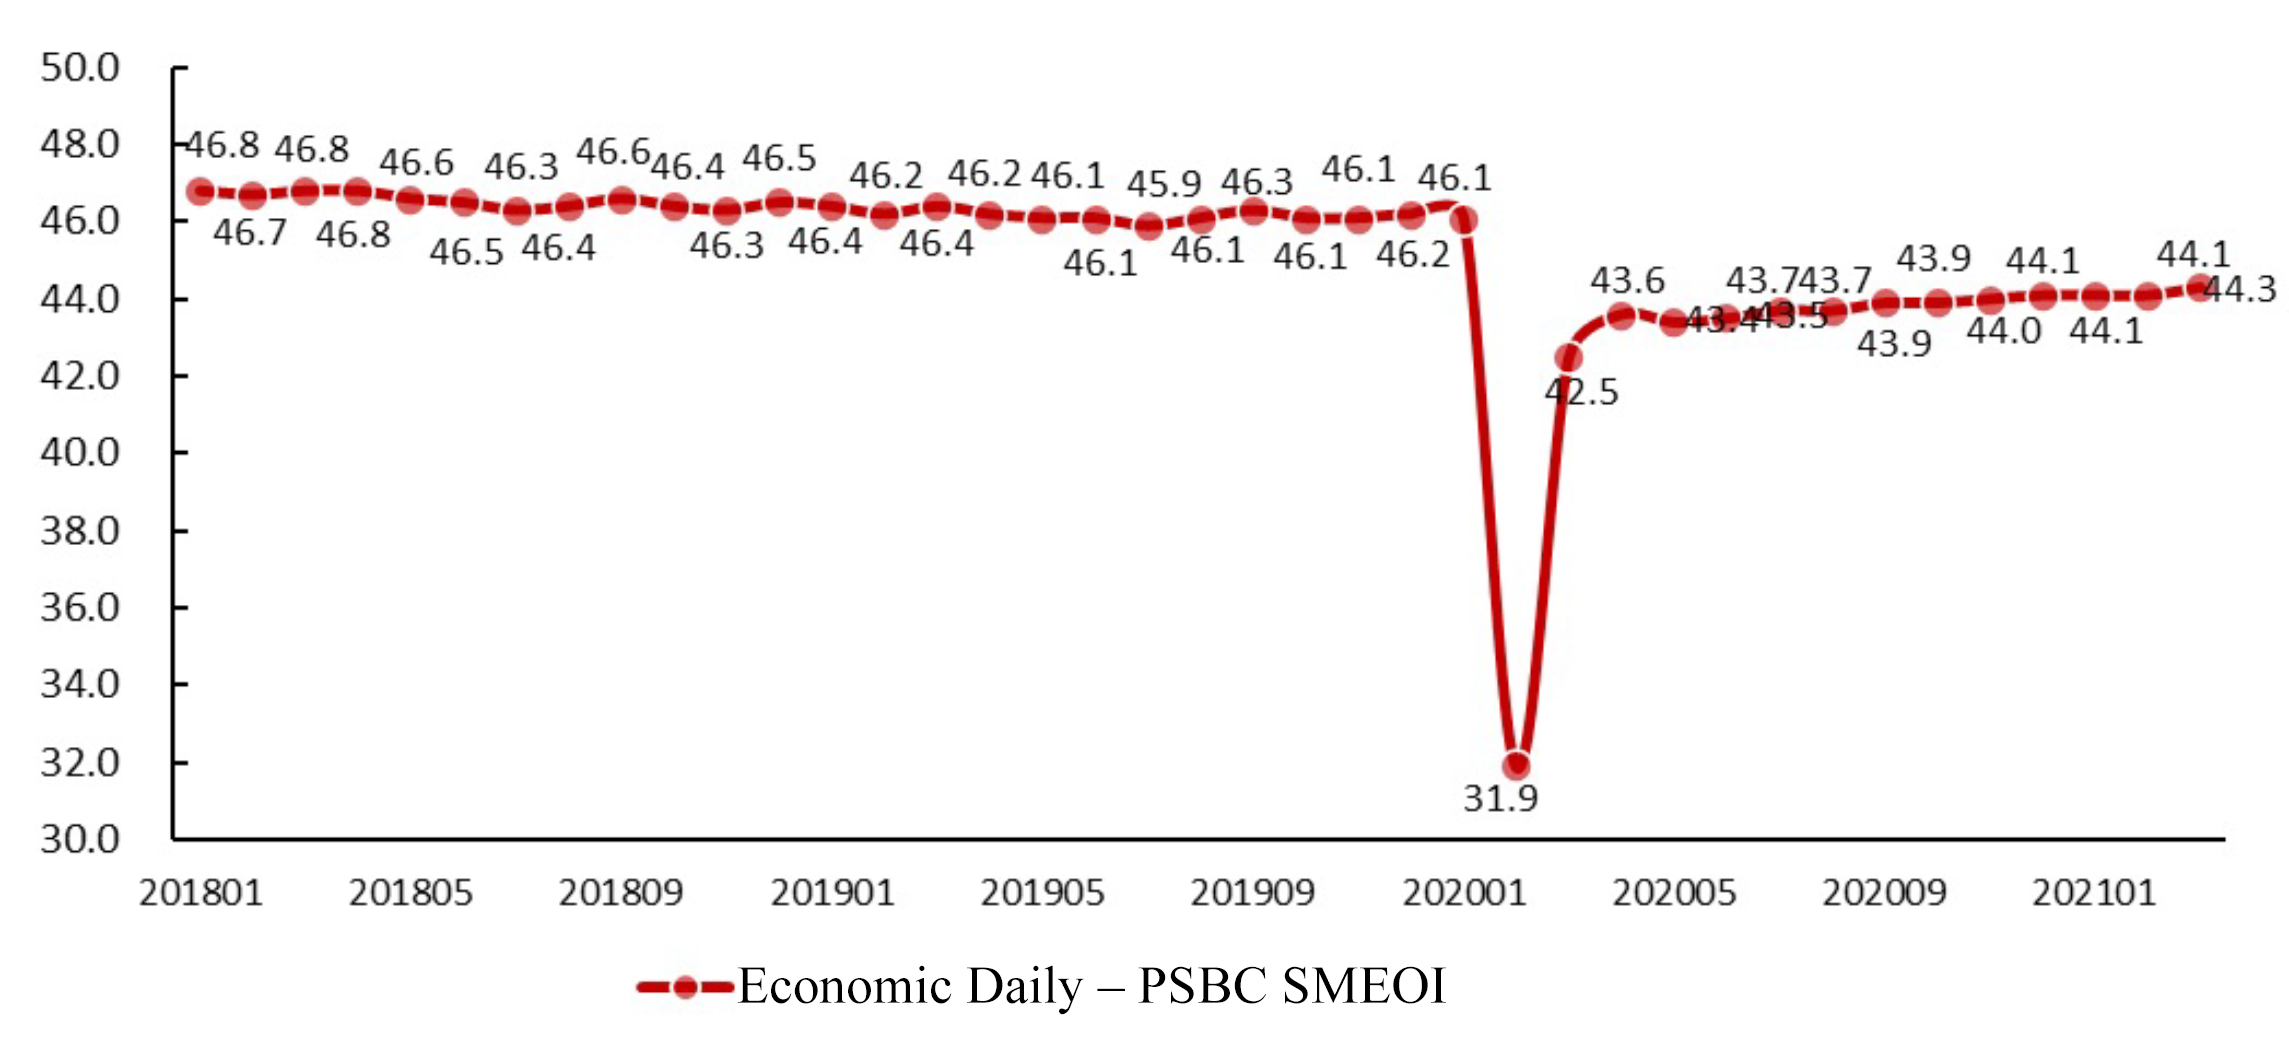
The Economic Daily – PSBC Small and Micro-sized Enterprise Operating Index (SMEOI) (See Fig. 1)reported 44.3 in March 2021, up 0.2 point compared with last month.
Fig. 1 Economic Daily– PSBC SMEOI
Economic Daily – PSBC SMEOI
II. Five component indices went up, two remained unchanged, and one went down, with substantial increases of the market index and the purchasing index
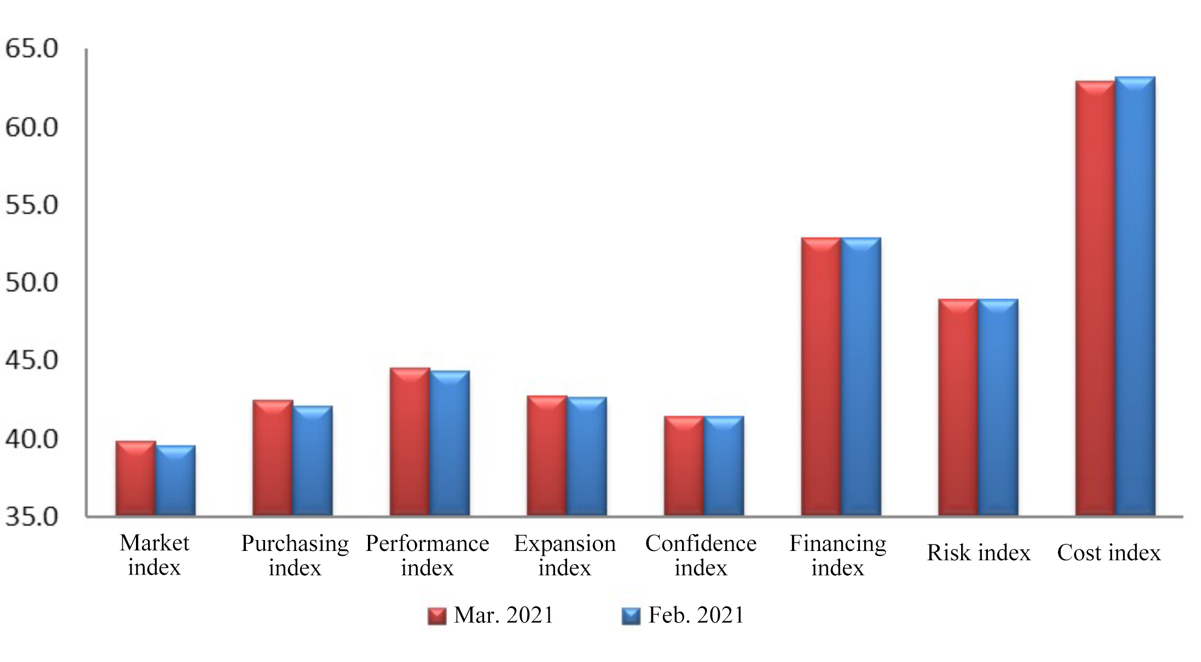
Among the eight component indices (See Fig. 2), five indices went up, two remained unchanged, and one went down. In addition to the declined cost index and the unchanged confidence index and risk index, other indices went up.
Fig. 2 Component Indices of Economic Daily – PSBC SMEOI
Among them, the market index of SMEs rose by 0.3 point to 39.8. Specifically, the market showed an obvious sign of recovery this month. Except thatthe business volume and the income from principal businesssub-indicesof the accommodation & catering industry remained unchangedand fell from the previous monthrespectively,theoutput, order volume and income from principal businesssub-indices under the market index of other industries increased.In addition, the increase in demand further drove the rise of purchase volume in the wholesale & retail industry and the raw material purchase volume in several industries.
By industry, the market index of the agriculture, forestry, animal husbandry & fishery industry was 39.6 in March, up 0.1 point; and that of the manufacturing and construction industries reached 39.1 and 37.4, up 0.5 point and 0.3 point respectively. The market index of transportation and wholesale & retail industries reported 41.0 and 42.3 respectively, up 0.3 point and 0.1 point. The market index of the accommodation & catering industry was 38.6, the same as the previous month; and that of the service industry was 36.7, up 0.2 point.
Fig. 3 Market Index and Purchasing Index
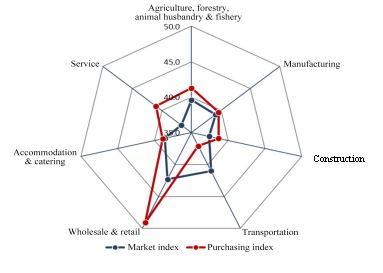
The purchasing index of SMEs was 42.4, up 0.3 point from the previous month. According to the survey results, among the seven major industries, the raw material purchase volume index of six industries showed a rising trend, while that of one industry remained unchanged. Except for the raw material purchase volume of the accommodation & catering industry which was the same as last month, the purchase volume of the wholesale & retail industry and the raw material purchase volume of other industries increased.
By industry, the purchasing index of the agriculture, forestry, animal husbandry & fisheryindustry was 41.3, up 0.1 point from last month; and that of the manufacturing and construction industriesreached39.6and 38.7,up 0.4 pointand 0.4 pointrespectively. The purchasing index of transportation and wholesale & retail industries reported 37.1 and 49.1 respectively, up 0.3 point and 0.1 point. The purchasing index of the accommodation & catering industry posted 38.9, on apar with that in the previous month, and that of the service industry stood at 41.0, an increase of 0.1 point.
The expansion index that reflects the businessexpectations of SMEs rose by 0.1 point, and the confidence index remained unchanged from the previous month.
By industry, except for the wholesale & retail industry and the service industry whose expansion index remained the same as last month, the demand for new investments and employment in other industries increased. Specifically, the expansion index of the agriculture, forestry, animal husbandry & fishery industry stood at 43.3, up 0.2 point, and its demand for new investments and employment both rose by 0.2 point; the expansion index of the manufacturing industry was 44.8, up 0.2 point, and its demand for new investments and employment increased by 0.1 point and 0.4 point respectively; the expansion index of the construction industry was 35.8, up 0.2 point, and its demand for new investments and employment ascended by 0.1 point and 0.3 point respectively; the expansion index of the transportation industry was 39.6, up 0.2 point, and its demand for new investments and employment went up 0.2 point and 0.1 point respectively; besides, the expansion index of accommodation & catering industry was 34.7, up 0.1 point, and its demand for new investments and employment both rose by 0.1 point.
Fig4. Expansion Index and Confidence Index
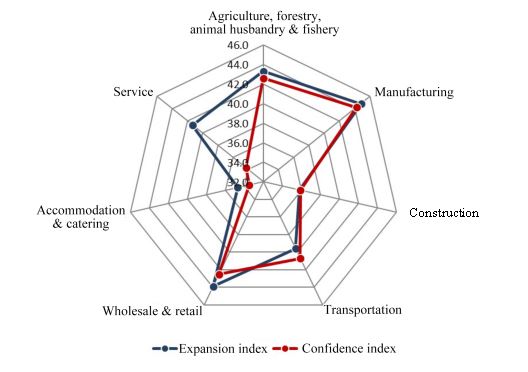
By industry, the confidence index of industries including agriculture, forestry, animal husbandry & fishery, construction, transportation, and accommodation & catering increased, that of the manufacturing and service industries remained unchanged, while that of the wholesale & retail industry declined. Specifically, the confidence index of the agriculture, forestry, animal husbandry & fishery industry was 42.6, up 0.3 point; that of the manufacturing industry was 44.2, the same as last month. The confidence index of the construction and transportation industries stood at 35.9 and 40.7 respectively, up 0.3 point and 0.2 point; that of the wholesale & retail industry reached 42.5, down 0.1 point; that of the accommodation & catering industry was 33.5, up 0.1 point; and that of the service industry registered 34.3, remaining unchanged from the previous month.
In addition, the performance index in March was 44.5, up 0.2 point; the financing index was 52.9, up 0.1 point; the risk index was 48.9, the same as last month; and the cost index was 62.9, down 0.3 point.
Judging from the trend of the past 12 months, the overall index rose steadily. The market index, performance index and confidence index presented a continuous recovery trend. The purchasing index and expansion index fluctuated within a certain range. The risk index improved recently, while the financing index and cost index remained above the threshold, reflecting the continued improvement in the financing environment for SMEs and the continuous decline in overall costs.
III. The indices of five regions rose, and that of one region remained unchanged, with the largest rise in North China and Central & Southern China
Among the six regional indices (See Fig. 5), five of them went up, and one remained unchanged. Except for Southwest China, the indices in other regions increased.
The North China index was 42.0 and that of Central & SouthernChina was 46.4, both rising by 0.3 point. Specifically, in terms of North China, the market index was 36.7, up 0.4 point; the purchasing index was 39.4, up 0.3 point; the performance index was 41.9, up 0.3 point; the expansion index was 38.0, up 0.3 point; and the confidence index was 38.3, up 0.1 point. In terms of the Central & SouthernChina, the overallindex was 46.4, an increase of 0.3 point. Its market index was 44.1, up 0.4 point; the purchasing index was 46.0, up 0.4 point; the performance index was 44.5, up 0.3 point; the expansion index was 44.7, up 0.3 point; and the financing index was 54.9, up 0.1 point.
Fig. 5 Regional Development Index
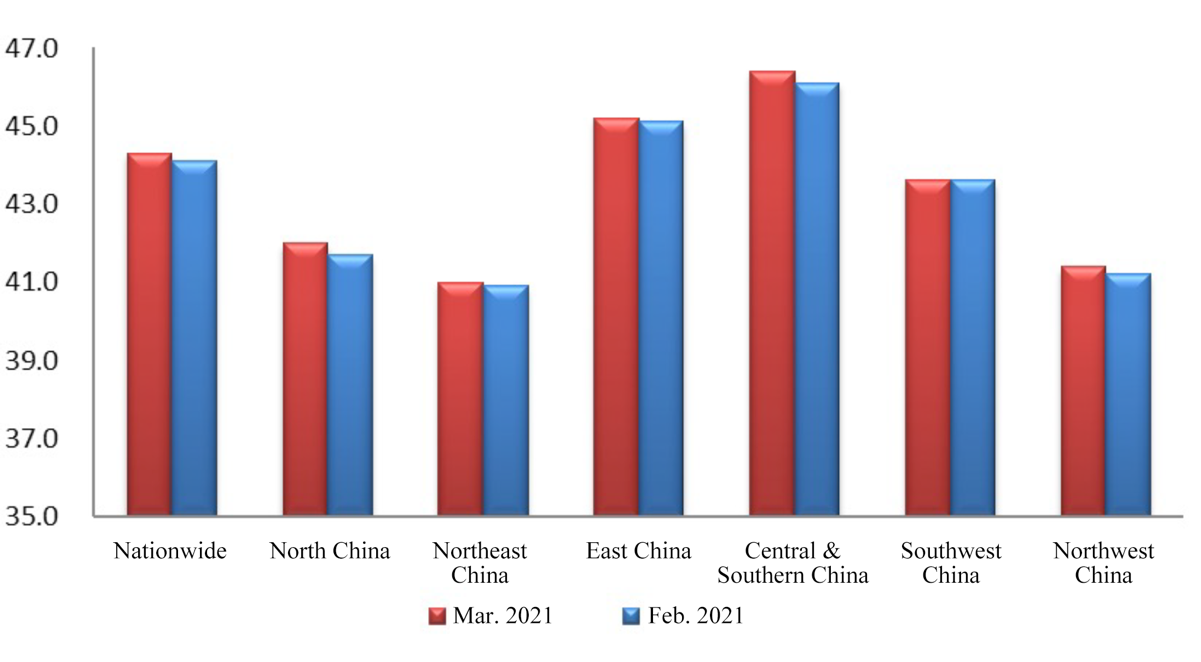
In addition, the market index, purchasing index and confidence index of Northeast China rose sharply by 0.2 point; and the purchasing index in East China increased the most by 0.3 point.
Specifically, the Northeast China index was 41.0, up 0.1 point. Its market index was 34.9, up 0.2 point; the purchasing index was 37.9, up 0.2 point; the performance index was 41.4, unchanged from the previous month; the expansion index was 38.9, up 0.1 point; the confidence index was 42.5, up 0.2 point; the financing index was 50.2, up 0.1 point; and the risk index was 52.9, the same as last month.
The East China index recorded 45.2, up 0.1 point. Its market index was 43.3, up 0.2 point; the purchasing index was 45.1, up 0.3 point; the performance index was 45.7, up 0.1 point; the expansion index was 44.1, up 0.1 point; the financing index was 49.2, the same as last month; and the risk index was 48.4, down 0.1 point.
The Southwest China index registered 43.6, the same as last month. Its market index was 41.6, up 0.1 point; the purchasing index was 44.2, up 0.1 point; the performance index was 44.6, up 0.1 point; and the expansion index was 43.5, unchanged from the previous month.
The Northwest China index reached 41.4, up 0.2 point. Its market index was 37.2, up 0.2 point; the purchasing index was 37.1, up 0.1 point; the performance index was 44.0, up 0.1 point; the expansion index was 39.8, up 0.2 point; the confidence index was 32.9, up 0.1 point; the financing index was 50.2, up 0.3 point; and the risk index was 47.8, down 0.1 point.
IV. The indices of five industries rose, that of two industries remained unchanged, while the biggest rise went to the manufacturing industry
According to the SMEOI of various industries (See Fig. 6), except for the wholesale & retail industry and the accommodation & catering industry whose indices stayed the same as the previous month, the SMEOI of other industries rose, of which the manufacturing industry had the largest increase.
Fig.6 Comparison of Industry Indices
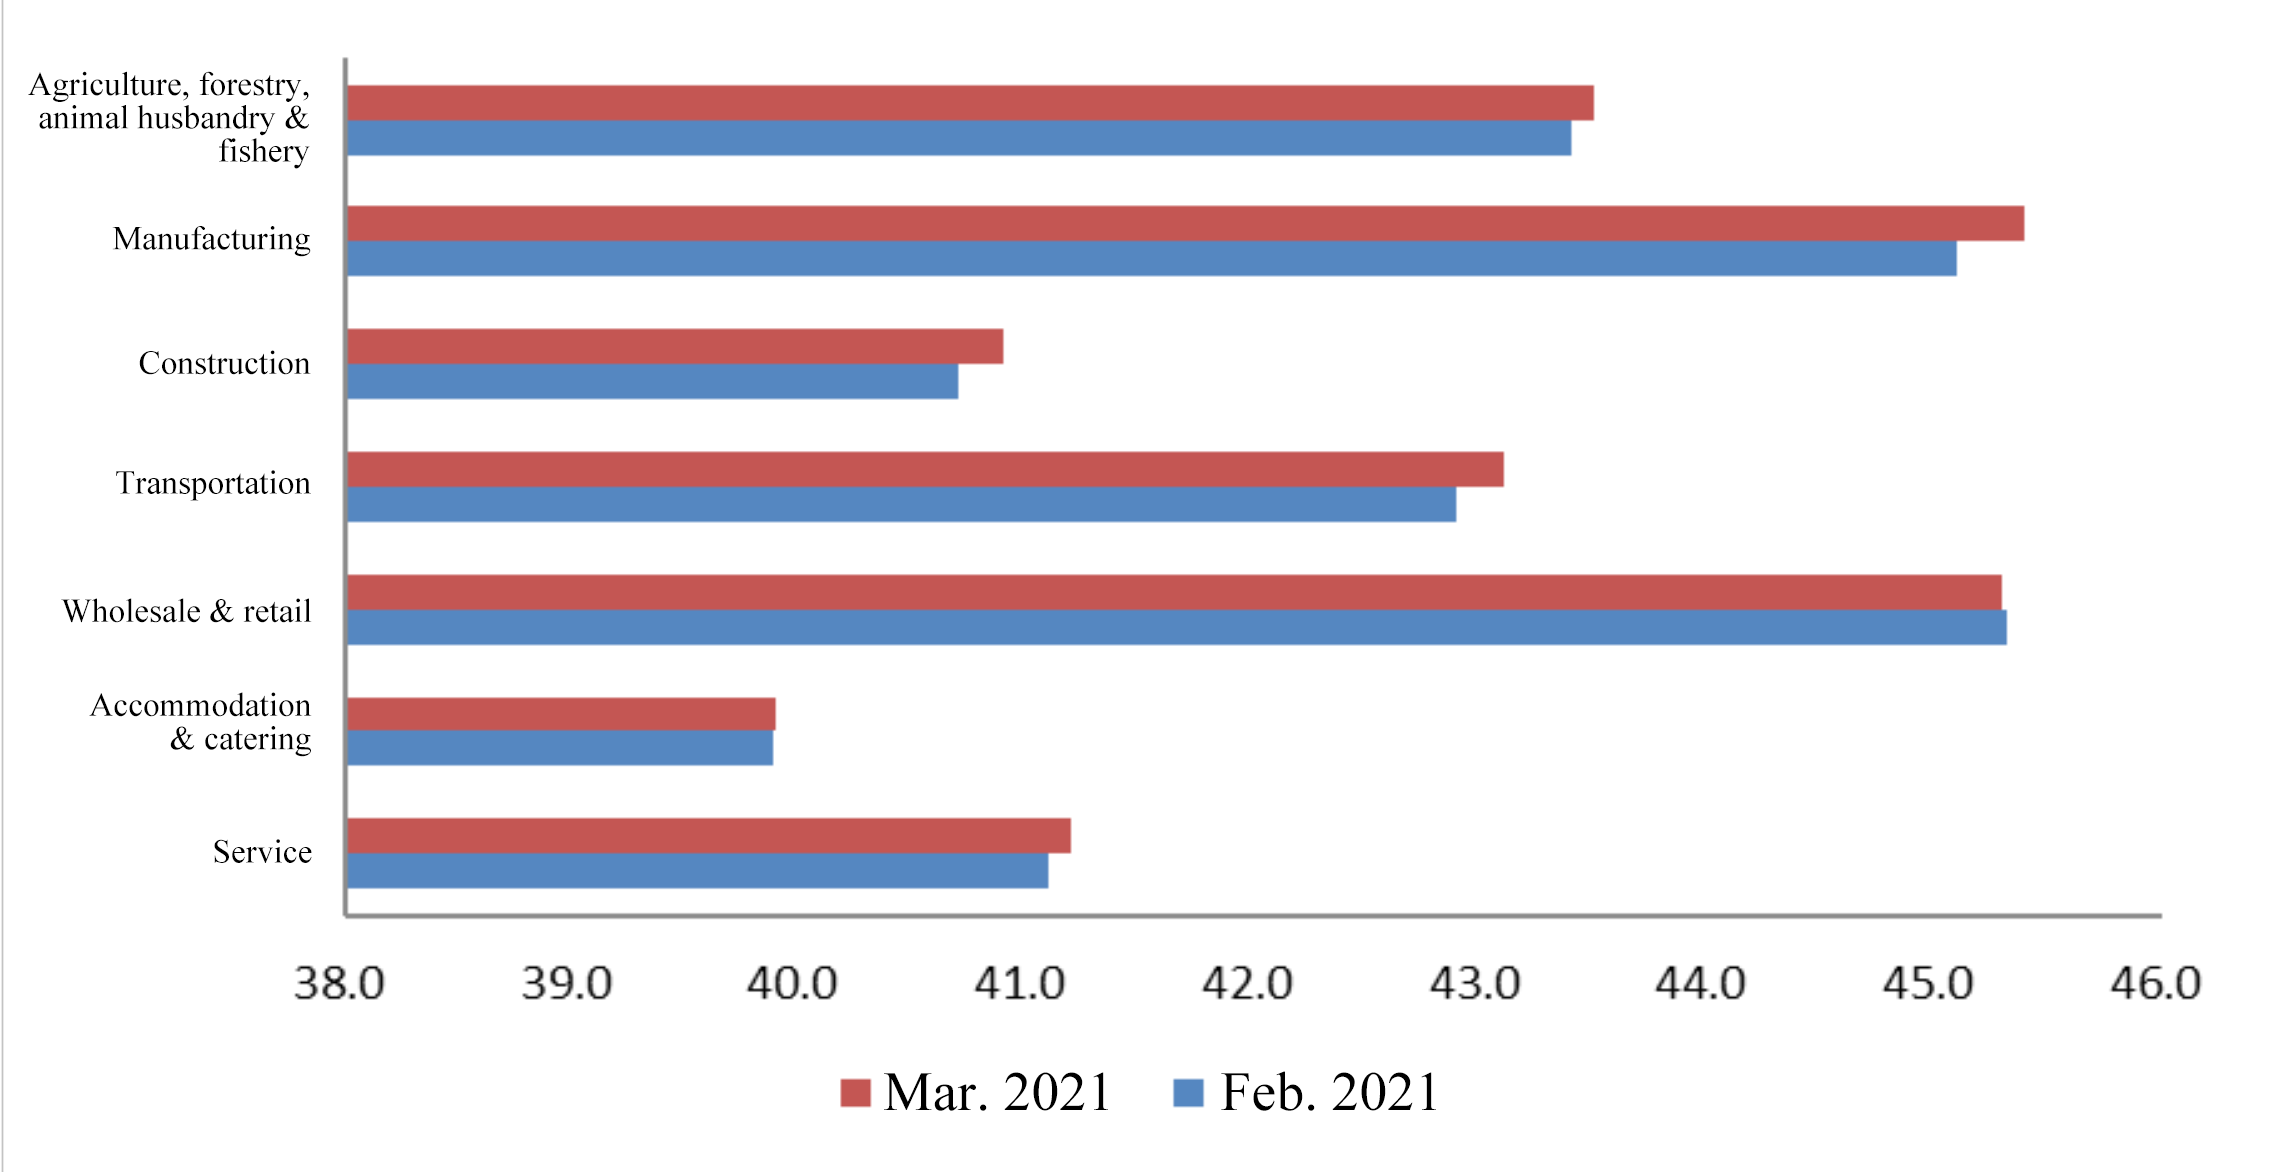
According to the changes in industry indices, the SMEOI of the manufacturing industry was 45.4, up 0.3 point. Its market index was 39.1, up 0.5 point from the previous month; the purchasing index was 39.6, up 0.4 point; and the performance index was 48.3, up 0.3 point. The survey results show that the output of small and micro-sized manufacturing enterprises increased by 0.7 point in March, and its order volume,income from principal business, raw material purchase volume, raw material inventory, profits and gross profit margin rose by 0.6 point, 0.5 point, 0.4 point, 0.5 point, 0.6 point and 0.3 point respectively.
In addition, the SMEOI of the construction and transportation industries increased by 0.2 point, that of the agriculture, forestry, animal husbandry & fishery industry and the service industry rose by 0.1 point, while that of the industries such as wholesale & retail and accommodation & catering remained unchanged from the previous month. Specifically, the financing index of the agriculture, forestry, animal husbandry & fishery industry presented the biggest rise at 0.4 point; the market index of the manufacturing industry has the largest increase at 0.5 point; the purchasing index of construction industry saw the biggest rise at 0.4 point; and the biggest rise in the risk index of the transportation industry was 0.4 point; besides, the market index, purchasing index, performance index and financing index of the wholesale & retail industry increased by 0.1 point; in the accommodation & catering industry, the expansion index and confidence index rose significantly by 0.1 point; and the market index of the service industry rose the most by 0.2 point.
Notes:
All the indicators are positive ones with the value ranging between 0 and 100; the critical point is 50, representing the general status. An index higher than 50 indicates an improving business situation. Otherwise, the business situation gets worse.
The original data of both the risk index and the cost index have been adjusted to positive indicators. The higher the index is, the better the situation is.

Copyright(C)2024 psbc.com All Rights Reserved 中国邮政储蓄银行 版权所有 京ICP备07021605号

 Mobile Bank
 Wechat