2021-02-08
Research Group of
Economic Daily –PSBC Small and Micro-sized Enterprise Operating Index
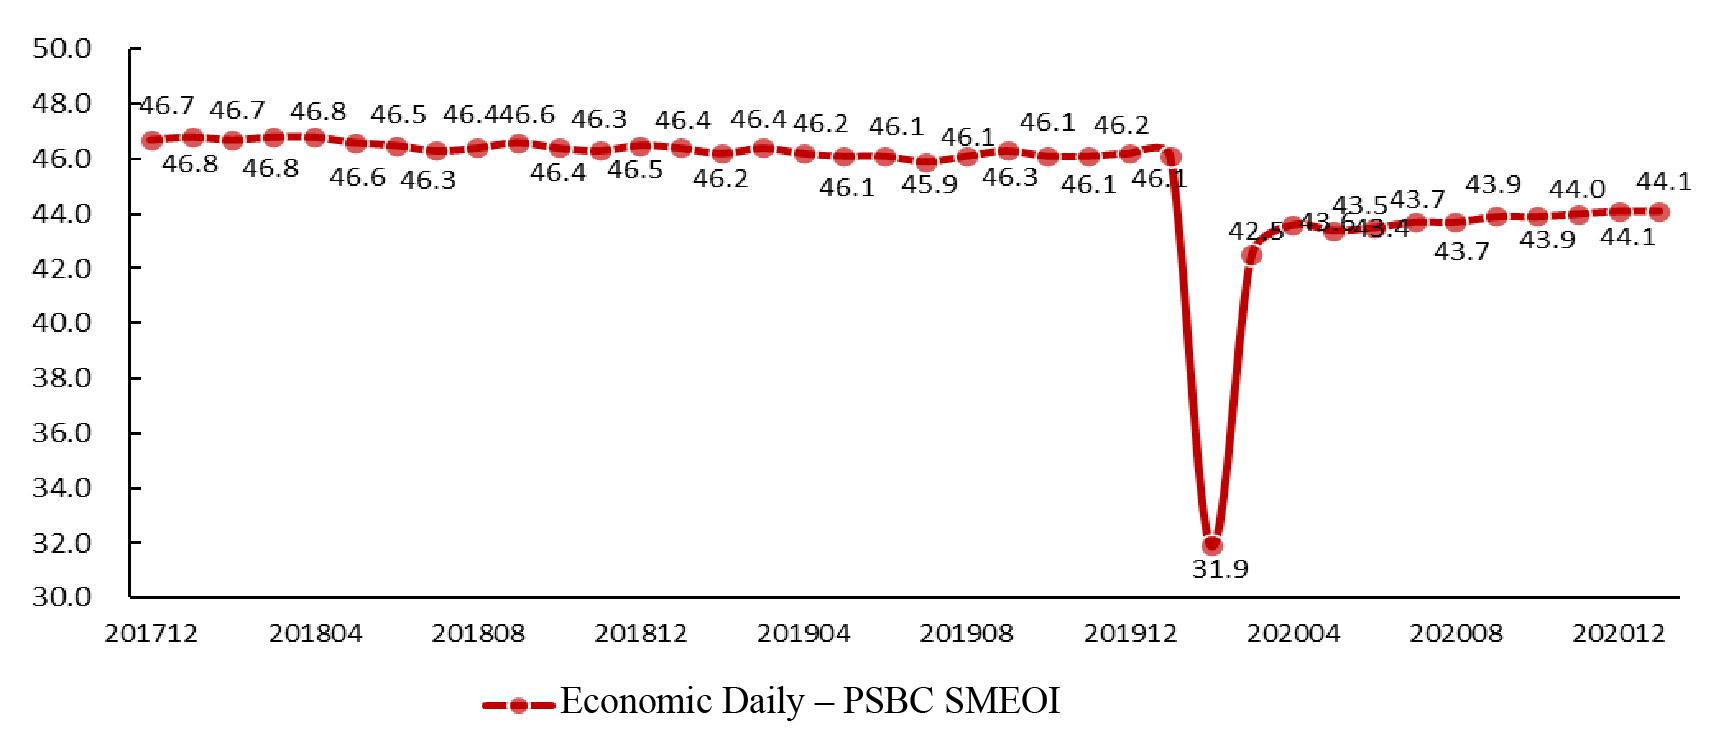
The Economic Daily –PSBC Small and Micro-sized Enterprise Operating Index (SMEOI) (See Fig. 1)reported 44.1 in January 2021, remaining unchanged compared with last month.
Fig. 1 Economic Daily–PSBC SMEOI
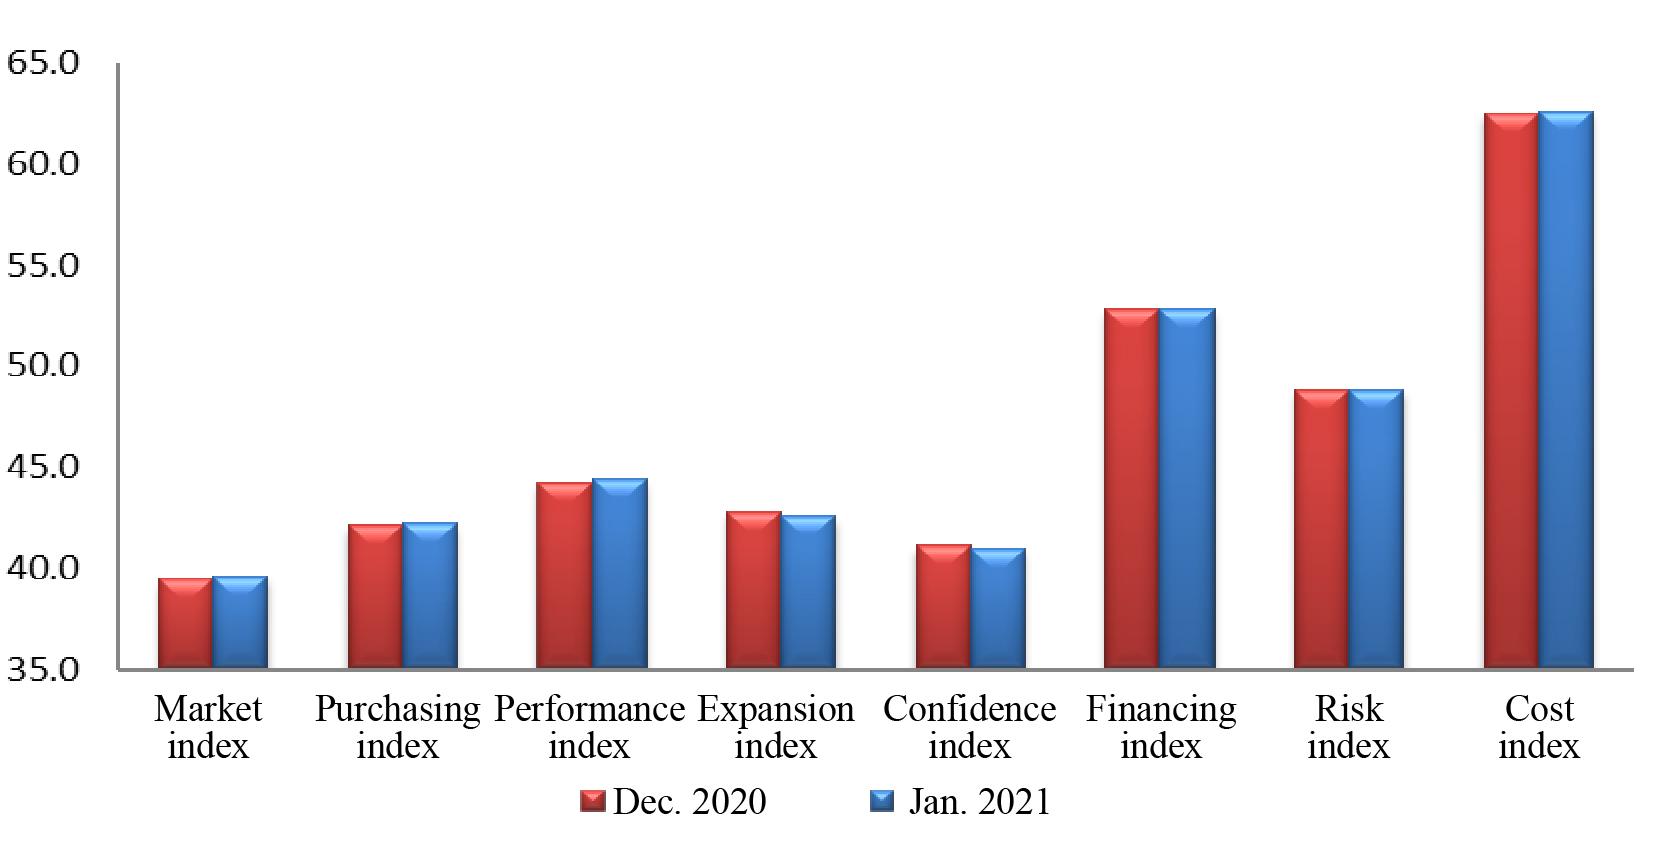
Among the eight component indices (See Fig. 2), four indices went up, two remained unchanged, and two went down. Specifically, the market index was 39.6, up 0.1 point; the purchasing index stood at 42.2, up 0.1 point; the performance index registered 44.4, up 0.2 point; the expansion index fell 0.2 point to 42.6; the confidence index posted 41.0, down 0.1 point; the financing index recorded 52.8, the same as last month; the risk index was 48.8, on par with that in the previous month; and the cost index closed at 62.6 after an increase of 0.1 point.
Fig. 2 Component Indices of Economic Daily – PSBC SMEOI
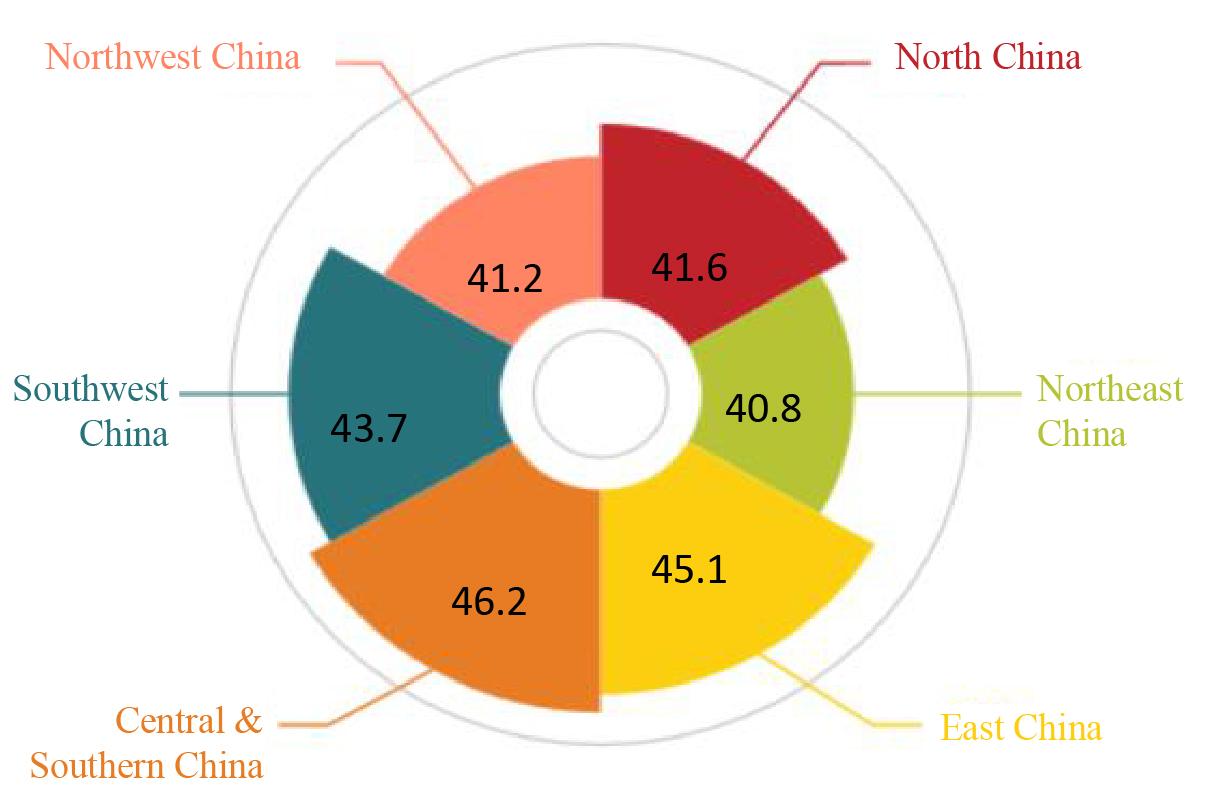
Among the six regional development indices (See Fig. 3), two indices went up and four went down. Specifically, the North China index stood at 41.6, down 0.4 point; Northeast China index at 40.8, down 0.3 point; East China index at 45.1, up 0.1 point; Central & Southern China index at 46.2, down 0.2 point; Southwest China index at 43.7, up 0.1 point; and Northwest China index at 41.2, down 0.1 point.
Fig. 3 Regional Development IndicesIndex
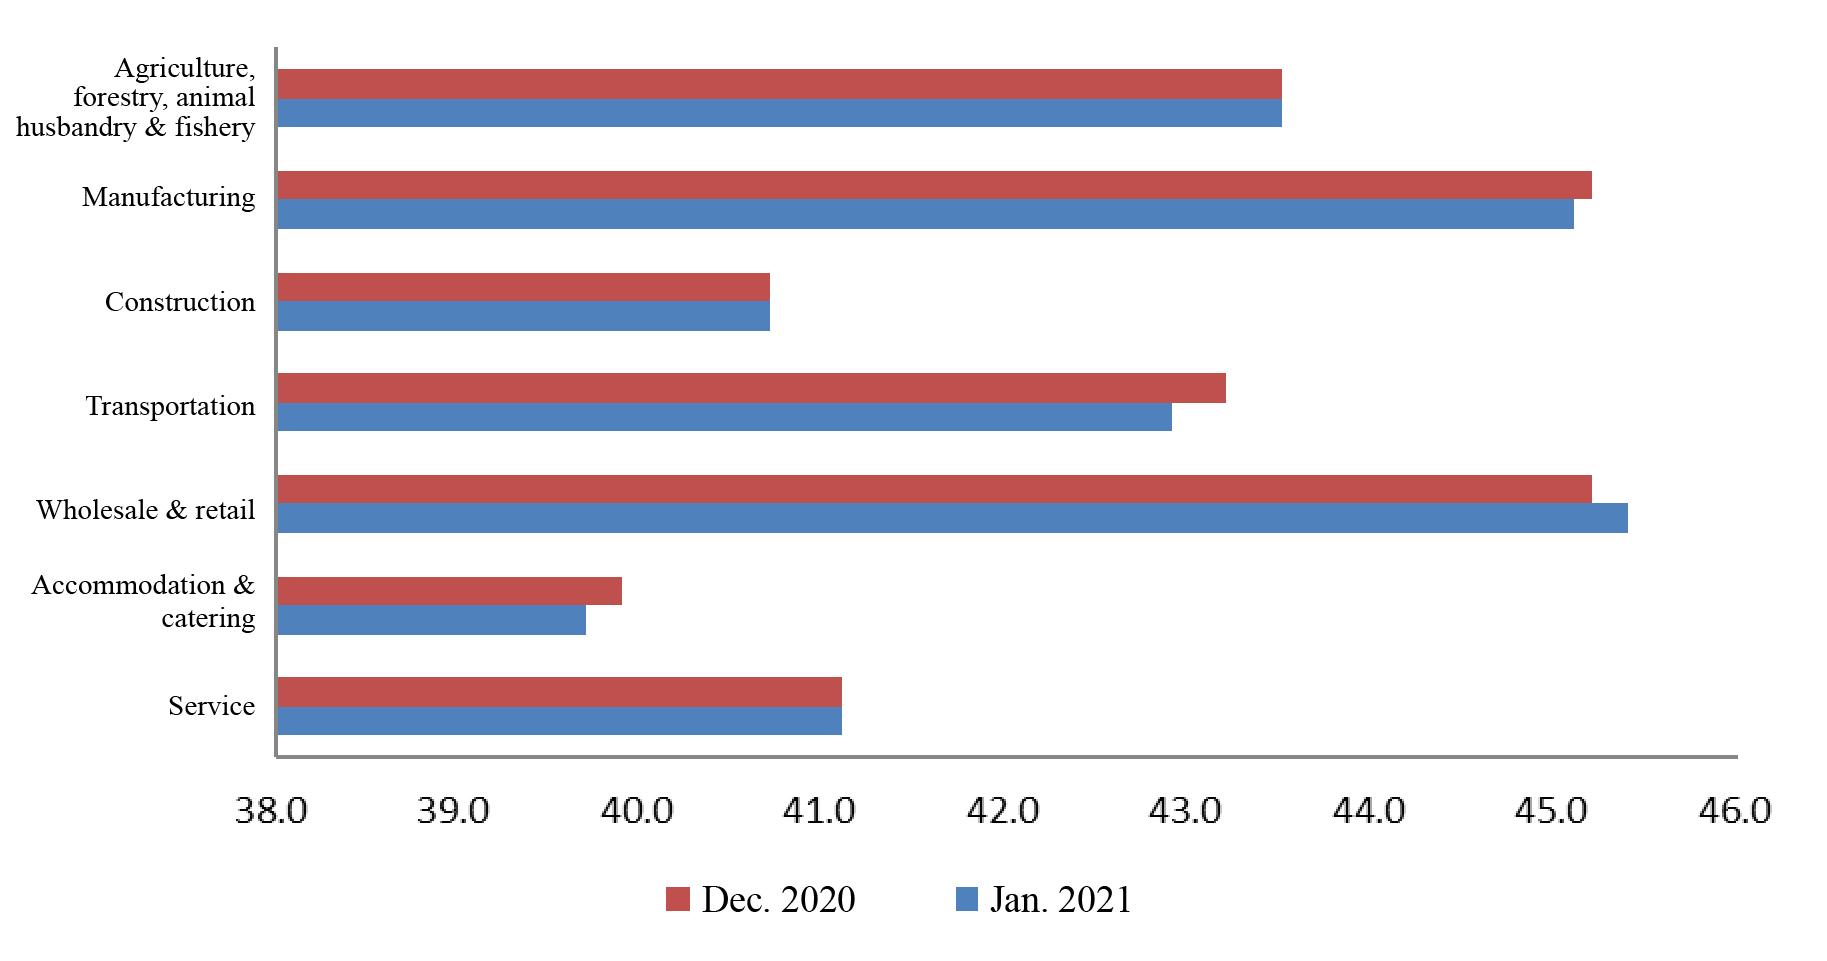
One out of the seven industry indices went up, three remained unchanged, and the other three went down.
Among the industry indices (See Fig. 4), the indices of agriculture, forestry, animal husbandry & fishery, construction and service were on par with those in the previous month, the wholesale & retail industrysaw its index going up, and the indices of other industries decreased to varying extents.
Fig. 4 Comparison of Industry Indices
The index of the agriculture, forestry, animal husbandry & fishery industry reported 43.5 in January, the same as last month. Specifically, the market index increased by 0.1 point to 39.6, and the purchasing index and the performance index fell by 0.1 point to 41.3 and 43.6, respectively. Seen from the survey results, SMEs in the industry witnessed an increase of0.1 point in output, order volume and raw material inventory respectively, and a decrease of 0.1 point in raw material purchase volume, dragging down the profits by 0.1 point, with a basically flat gross profit margin.
The index of the manufacturing industry reported 45.1 in January, down 0.1 point from the previous month. Specifically, the market index dropped by 0.1 point to 38.7, and the purchasing index and the performance index posted 39.3 and 48.1 respectively, the same as the previous month. Seen from the survey results, SMEs in the industry witnessed a decrease of 0.1 point in order volume, income from principal business and raw material purchase volume, and an increase of 0.1 point in raw material inventory, resulting in essentially flat profits and gross profit margin.
The index of the construction industry reported 40.7 in January, on par with that in the previous month. Specifically, the market index fell by 0.2 point to 37.1, the purchasing index dropped by 0.2 point to 38.3, and the performance index went up by 0.6 point to 41.9. Seen from the survey results, SMEs in the industry witnessed a decrease of 0.1 point in project volume, income from project settlement and raw material purchase volume, and a decrease of 0.2 point in raw material inventory, with the profits and the gross profit margin both rising by 0.3 point.
The index of the transportation industry reported 42.9 in January, down 0.3 point from the previous month. Specifically, the market index, purchasing index and performance index fell by 0.4 point, 0.2 point and 0.4 point to 40.7, 36.8 and 43.0, respectively. Seen from the survey results, SMEs in this industry witnessed a decrease of 0.5 point, 0.3 point, 0.3 point, 0.2 point and 0.1 point in transportation volume, business order volume, income from principal business, raw material purchase volume and raw material inventory, thus dragging down the profits and the gross profit margin by 0.3 point and 0.1 point, respectively.
The index of the wholesale & retail industry stood at 45.4 in January, up 0.2 point from the previous month. Specifically, the market index, the purchasing index and the performance index rose by 0.3 point, 0.5 point and 0.4 point to 42.2, 49.1 and 42.6, respectively. The trend was evidenced by an increase of 0.1 point, 0.2 point and 0.7 point in sales order volume, sales volume and amount of purchase, which drove up the profits and gross profit margin by 0.2 point and 0.1 point, respectively.
The index of the accommodation & catering industry reported 39.7 in January, down 0.2 point from the previous month. The market index, the purchasing index and the performance index fell by 0.3 point, 0.1 point and 0.4 point to 38.3, 38.9 and 39.7, respectively. To be specific, SMEs in the industry witnessed a decrease of 0.3 point, 0.3 point and 0.1 point in business volume, income from principal business and raw material inventory, thus dragging down the profits and the gross profit margin by 0.2 point and 0.1 point, respectively.
The index of the service industry reported 41.1 in January, the same as last month. The market index fell by 0.1 point to 36.6, the purchasing index rose by 0.1 point to 40.9, and the performance index went up by 0.3 point to 39.5. To be specific, SMEs in the industry witnessed a drop of 0.1 point in business order volumeand a rise of 0.1 point and 0.2 point in raw material purchase volume and raw material inventory, with the profitsand the gross profit margin rising by 0.1 point and 0.2 point, respectively.
Two out of the six regional indices went up and the other four went down.
The North China index reported 41.6 in January, down 0.4 point from the previous month. Specifically, the market index, the purchasing index, the performance index, the expansion index, the confidence index, the financing index and the risk index fell by 0.6 point, 0.5 point, 0.4 point, 0.4 point, 0.3 point, 0.3 point and 0.3 point to 36.4, 39.0, 41.7, 37.5, 37.7, 53.7 and 47.0, respectively.
The Northeast China index reported 40.8 in January, down 0.3 point from the previous month. Specifically, the market index, the purchasing index, the performance index, the expansion index, the confidence index and the financing index fell by 0.2 point, 0.2 point, 0.4 point, 0,5 point, 0.5 point and 0.1 point to 34.8, 37.7, 41.3, 38.7, 41.9 and 50.0, respectively.
The East China index reported 45.1 in January, up 0.1 point from the previous month. Specifically, the market index, the performance index and the risk index rose by 0.1 point, 0.4 point and 0.1 point to 43.2, 45.6 and 48.6, respectively.
The Central & Southern China index reported 46.2 in January, down 0.2 point from the previous month. Specifically, the market index, the performance index, the expansion index, the confidence index, the financing index and the risk index dropped by 0.2 point, 0.1 point, 0.4 point, 0.3 point, 0.1 point and 0.1 point to 43.9, 44.3, 44.5, 41.4, 54.9 and 47.0, respectively.
The Southwest China index reported 43.7 in January, up 0.1 point from the previous month. Specifically, the market index, the purchasing index, the performance index and the risk index gained 0.1 point, 0.1 point, 0.5 point, and 0.1 point to 41.6, 44.3, 44.6 and 48.9, respectively.
The Northwest China index reported 41.2 in January, down 0.1 point from the previous month. Specifically, the market index, the financing index and the risk index fell by 0.3 point to 37.0, 49.9 and 47.8, respectively.
The financing demand remained unchanged, while the business expectations went down.
The financing index reflecting the financing demand of SMEs (See Fig. 5)posted 52.8 in January, on par with that in the previous month.
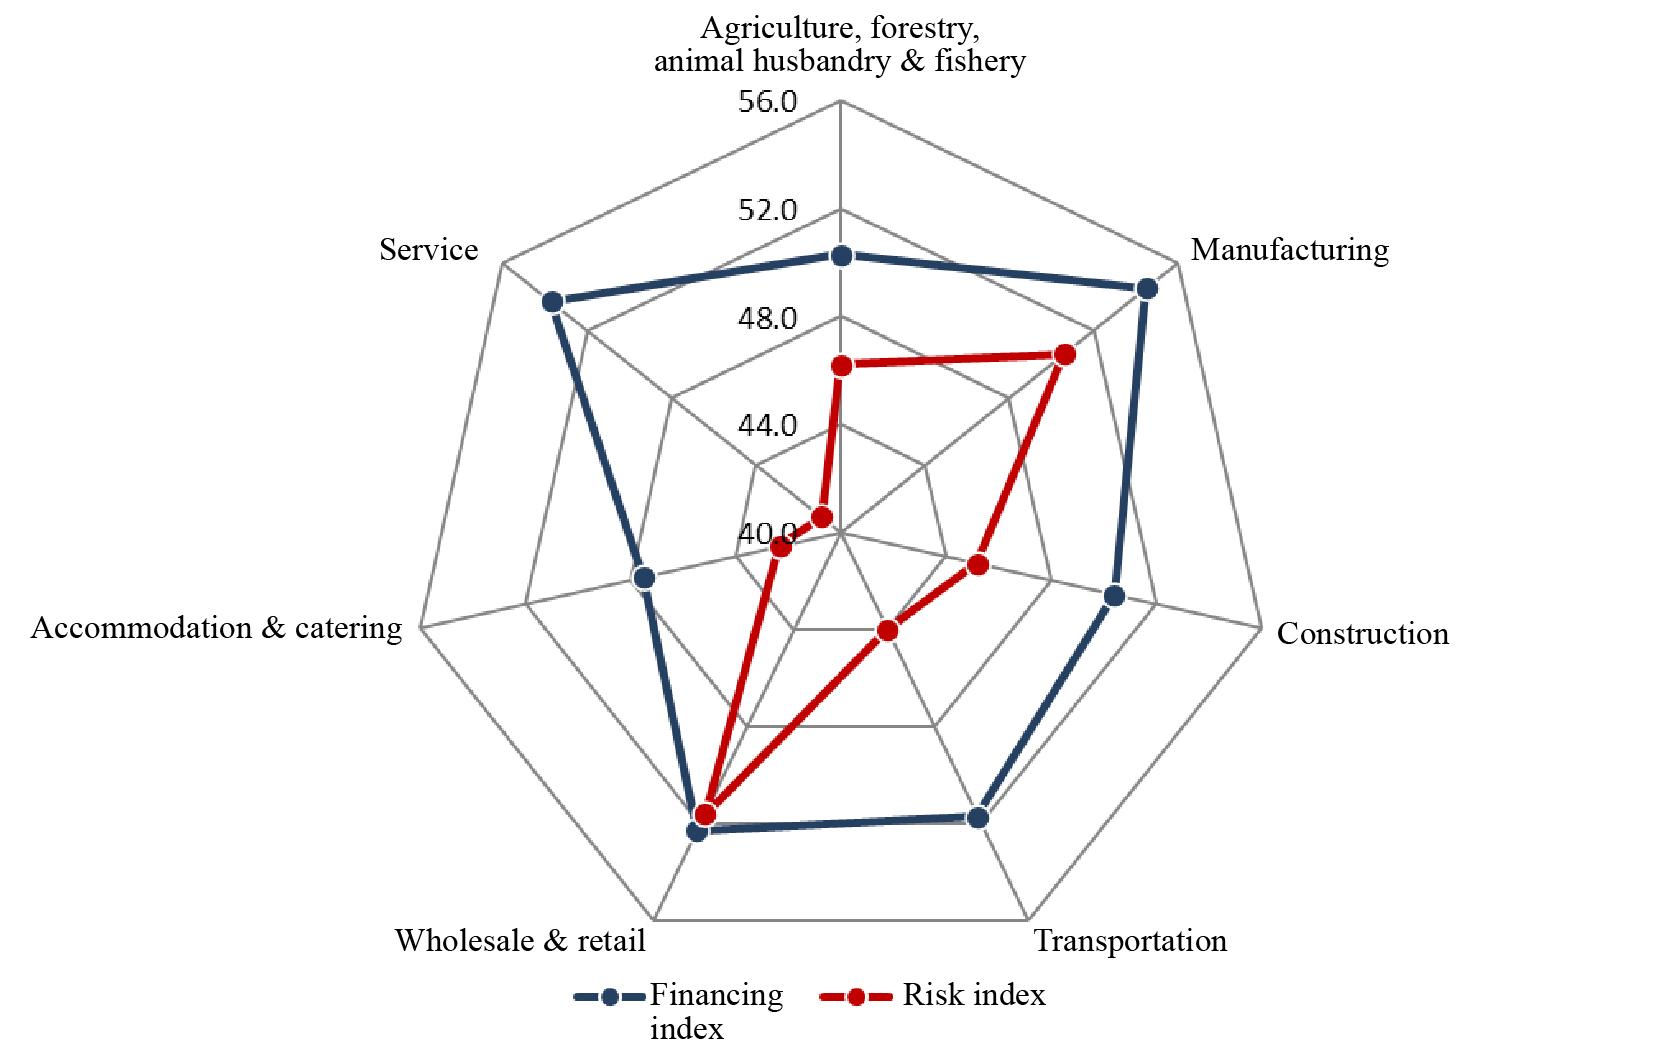
In the month, the index of the agriculture, forestry, animal husbandry & fishery industry fell 0.2 point to 50.3; that of the manufacturing industry went down 0.1 point to 54.5; that of the construction industry dwindled 0.1 point to 50.4; that of the transportation industry reported 51.7, the same as last month; that of the wholesale & retail industry gained 0.2 point to 52.3; that of the accommodation & catering industry rose by 0.1 point to 47.5; and that of the service industry edged down 0.1 point to 53.7.
The risk index of SMEs (See Fig. 5)recorded 48.8 in January, the same as last month.To be specific, the risk index of the agriculture, forestry, animal husbandry & fishery industry fell 0.2 point to 46.2; that of the manufacturing industry registered 50.6, on par with last month; that of the construction industry declined 0.4 point to 45.2; that of the transportation industry edged down 0.1 point to 44.0; that of the wholesale & retail industry stood at 51.6, up 0.3 point; that of the accommodation & catering industry reported 42.3, down 0.3 point; and that of the service industry went down by 0.1 point to 40.9.Seen from the survey results, two out of the seven industry working capital turnover indices went up, one remained unchanged, and the other four went down. All industries other than agriculture, forestry, animal husbandry & fishery, manufacturing and wholesale & retail generated a slightly slowed working capital turnover. The payment collection period index of the service industry remained unchanged, and the other six industries all managed to lengthenedthe payment collection period somewhat.
Fig. 5 Financing Index and Risk Index by Industry
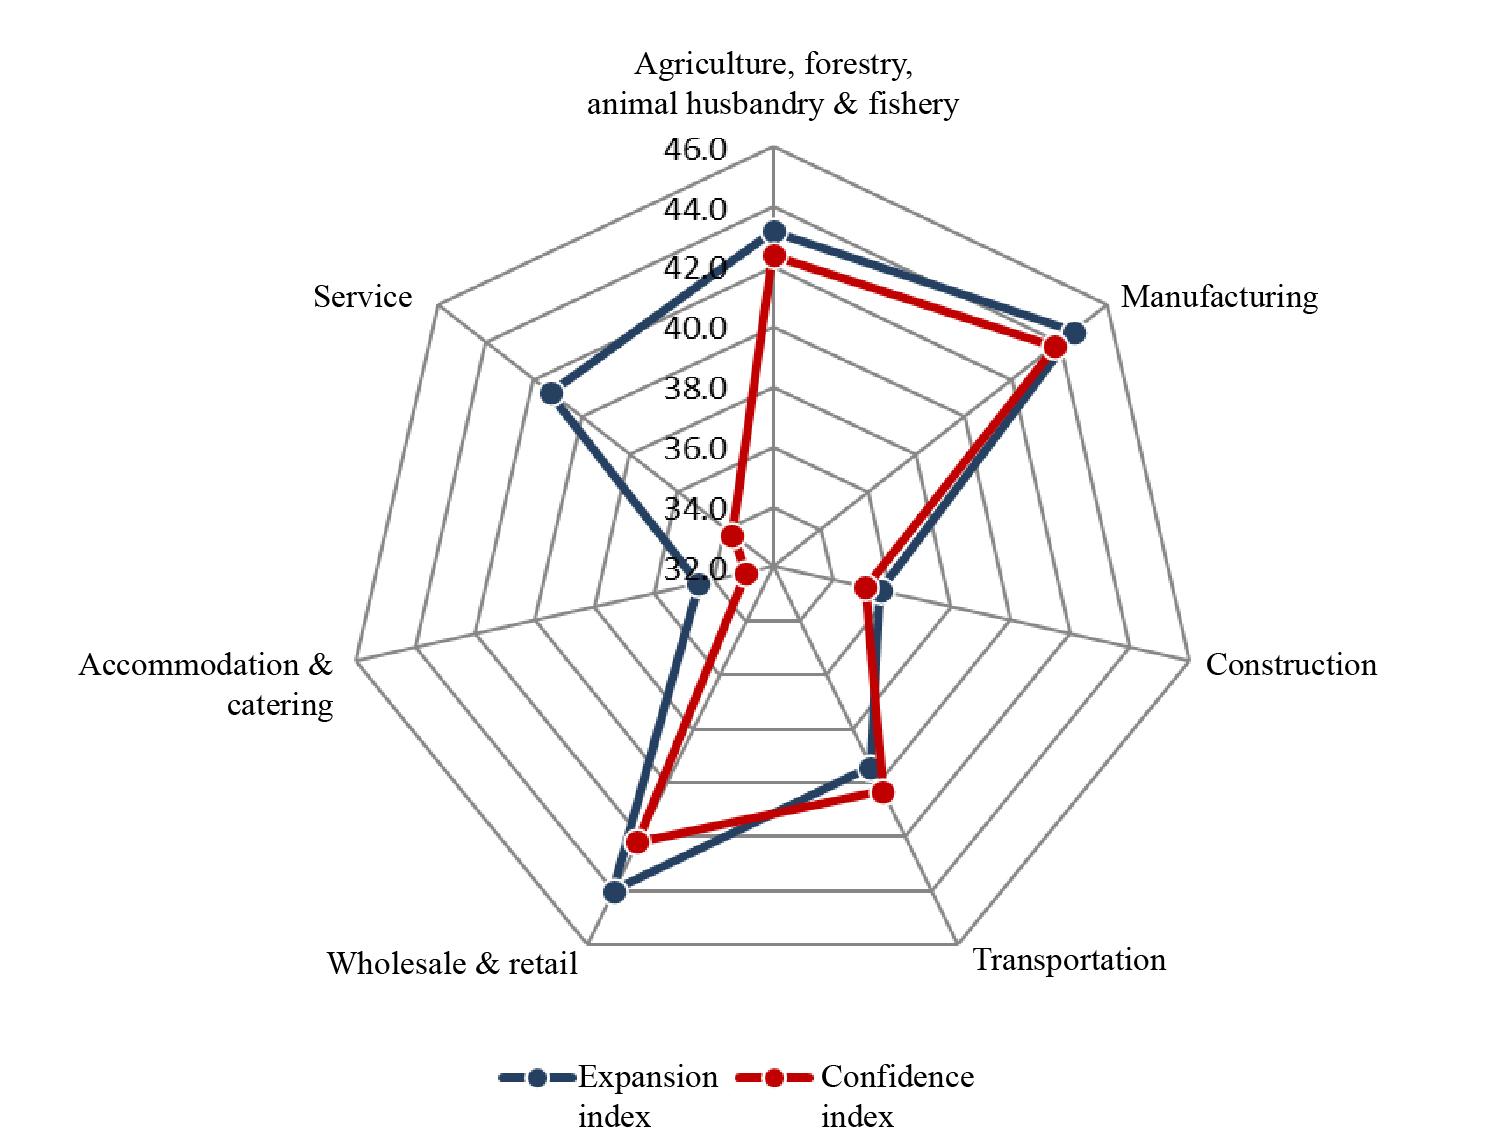
In January, the expansion index and the confidence index declined 0.2 point and 0.1 point respectively, both of which are used to reflect the business expectations of SMEs.
The expansion index of SMEs reported 42.6 in January, down 0.2 point from the previous month. In an industry-specific view, the expansion index of SMEs in agriculture, forestry, animal husbandry & fishery and construction remained unchanged, and SMEs in other industries saw their expansion index decreasing slightly. Specifically, the expansion index of SMEs in the manufacturing industry was 44.6, down 0.4 point, with the new investment demand falling by 0.1 point and the labor demand decreasing by 0.2 point; that in the transportation industry was 39.4, down 0.4 point, with the new investment demand falling by 0.4 point and the labor demand decreasing by 0.1 point; that in the wholesale & retail industry was 44.0, down 0.3 point, with the labor demand decreasing by 0.4 point; that in the accommodation & catering industry was 34.5, down 0.3 point, with the labor demand decreasing by 0.1 point; and that in the service industry was 41.3, down 0.1 point, with the labor demand decreasing by 0.1 point.
The confidence index of SMEs reported 41.0 in January, down 0.1 point from the previous month. In an industry-specific view, SMEs in all industries other than agriculture, forestry, animal husbandry & fishery and construction saw their confidence index going down slightly. To be specific, the confidence index of SMEs in agriculture, forestry, animal husbandry & fishery was 42.4, up 0.6 point; that in the manufacturing industry was 43.8, down 0.1 point; that in the construction industry was 35.1, up 0.1 point; that in the transportation industry was 40.3, down 0.2 point; that in the wholesale & retail industry was 42.2, down 0.1 point; that in the accommodation & catering industry was 32.9, down 0.3 point; and that in the service industry was 33.7, down 0.2 point.
Fig 6. Expansion Index and Confidence Index by Industry
Notes:
All the indicators are positive ones with the value ranging between 0 and 100; the critical point is 50, representing the general status. An index higher than 50 indicatesan improving business situation. Otherwise, the business situation gets worse.
The original data of both the risk index and the cost index have been adjusted to positive indicators. The higher the index is, the better the situation is.

Copyright(C)2024 psbc.com All Rights Reserved 中国邮政储蓄银行 版权所有 京ICP备07021605号

 Mobile Bank
 Wechat